 Vista
Need plant versus animal cell diagrams, mitosis stages or a potato osmosis school project? This visual guide presents three educational posters, covering the similarities and differences of eukaryotic cells, the main stages of mitosis and water movement across selectively permeable membranes. Students in approximately Classes 6–11 can prepare an A4 biology chart or a simple teacher-supervised observation using these pictures. Important distinctions must be kept: **not every plant cell has chloroplasts**, mitosis is not the entire cell cycle, and osmosis is not simply salt particles moving through potato tissues. Posters retain the site’s existing 15-second advertisement-supported image-view and download route.
What do plant and animal cells share?
Plant and animal cells are both eukaryotic and contain a plasma membrane, cytoplasm, a nucleus, mitochondria and many other cellular structures. Most familiar plant cells have a cell wall rich in cellulose and often a large central vacuole. Chloroplasts are found in photosynthetic cells but not necessarily in roots and other nonphotosynthetic tissues. Animals lack the typical plant-cell wall, though their cells also have membranes and internal organelles. A classroom comparison should show shared features before listing differences. Cell shape and size vary widely, so perfectly rectangular plant cells and circular animal cells are teaching conventions rather than universal forms.
Picture 1: Plant Cell versus Animal Cell
In the first poster, identify the cell membrane, nucleus and cytoplasm in both models. Label cell wall and large vacuole for the typical plant model, and chloroplast only where relevant to photosynthesis. Mitochondria are not exclusive to animals; plant cells contain them too. The distinct colours and neat shapes are chosen to aid recognition and should not be interpreted as direct microscopic appearances. If the graphic incorrectly gives an animal cell a cellulose wall, or assumes every root cell has chloroplasts, correct the label before drawing or printing it. A simple comparison table helps reinforce the distinctions.

View / Download after 15-second wait
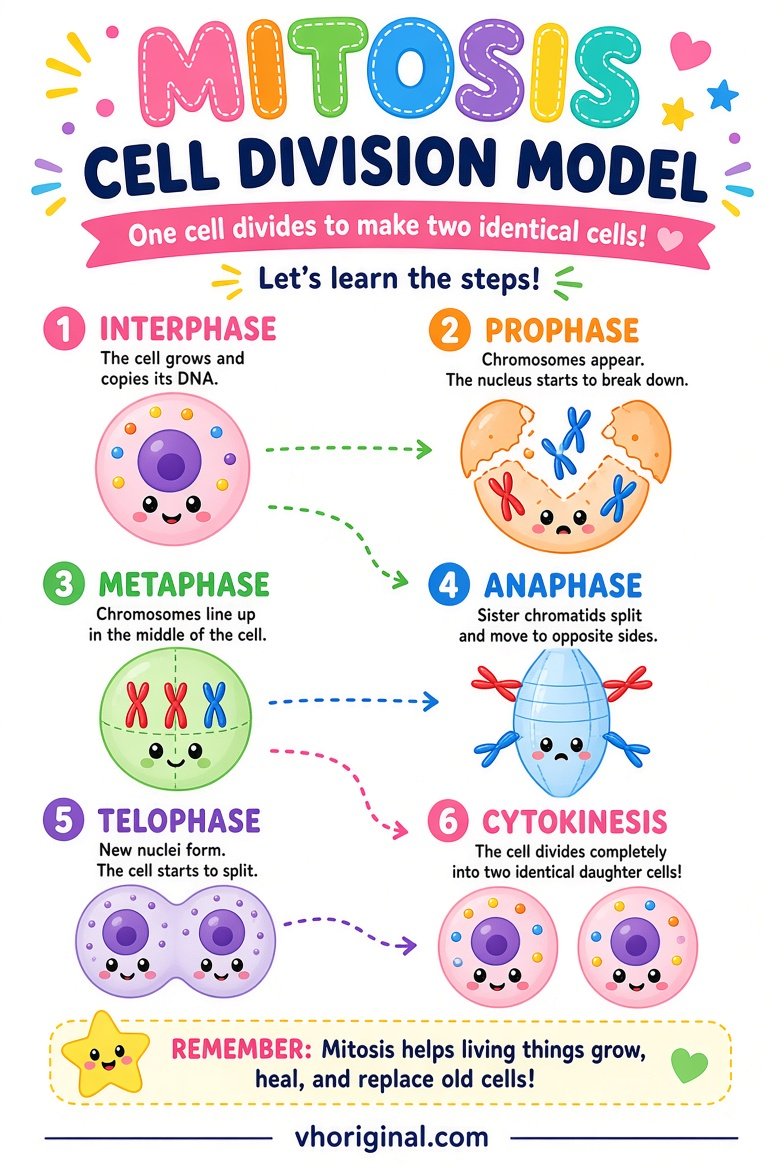
Picture 2: Mitosis Stage Diagram
The major stages typically taught are prophase, metaphase, anaphase and telophase. Chromosomes become condensed in prophase, line up near the middle during metaphase, and their sister chromatids move toward opposite poles in anaphase. Two nuclei form as telophase proceeds. Cytokinesis divides the cytoplasm and is related to, but distinct from, mitotic nuclear division. Interphase, a major part of the cell cycle, is not one of these four mitotic stages. Explain that diagrams simplify real biological timing. A stage sequence with reversed arrows or misplaced chromosomes can teach the wrong process even if it looks attractive.
View / Download after 15-second wait
Picture 3: Potato Osmosis Experiment
Osmosis concerns water movement across a selectively permeable boundary in response to differences in water potential. Potato tissue can provide a familiar classroom illustration because its cells gain or lose water under suitable conditions. A strip placed in plain water may become firmer, while one in a more concentrated salt solution may lose water and become less firm. Outcomes depend on the initial potato condition, solution concentration, temperature and time. Do not invent precise weight-change percentages or claim that every sample will behave identically. Explain the movement of water rather than calling it a demonstration that salt alone enters the cells.

View / Download after 15-second wait
Osmosis versus diffusion
Diffusion describes how particles spread through random motion and concentration gradients. Osmosis is specifically related to water moving across a selectively permeable membrane under a water-potential difference. A plant cell’s wall helps provide mechanical support, but its plasma membrane plays the central selective role. Adequate water can help maintain turgor pressure; water loss can reduce turgidity. Animal cells respond differently because they lack plant-cell walls. Students should not infer water direction merely from the colour of an illustrated liquid. Include labels for the membrane and for the conditions outside and inside the cell.
Safe materials and making a biology display
A4 chart paper, rulers, pencil, colour pens, cardboard and glue can produce the cell and mitosis models without any chemicals. A teacher-approved potato experiment may use two labelled plastic cups, mild salt solution, clean water and similar potato strips. An adult should cut the potato. Students must not eat the used samples or introduce strong acids and unknown chemicals. Mark mitosis stages with large headings and chromosome arrows, then make a separate box for osmosis. Use ‘Not to Scale’ where appropriate. If the assignment is only a diagram, a powered working setup is completely unnecessary.
Step-by-step potato observation
Record initial mass or size for two approximately equal potato strips if suitable equipment is available. Place one in water and one in an approved salt solution for the agreed duration. Remove them carefully, treat surface moisture consistently and record their final measurements or qualitative feel. Show Time, Sample, Liquid, Initial and Final in a table. If the changes are negligible, report that honestly and discuss the conditions that might affect the result. Do not rewrite the actual data to match a poster’s example. This is a classroom observation, not an industrial or medical quality test.
Viva answers and common mistakes
Teachers may ask which cells have walls, which mitotic stage separates sister chromatids and what moves in osmosis. Answer plant cells, anaphase and water. Do not put chloroplasts in every root cell; verify chromosome arrows against the textbook.
Download route and final presentation
The three posters use the existing 15-second image-ad page, not a direct-download shortcut. Use references for hand-drawn work, avoid eating experimental potato slices and wash hands. Check cell labels, stage order and membrane direction before submitting.
Frequently asked questions
What distinguishes a typical plant cell?
It has a cell wall; photosynthetic cells may have chloroplasts.
Do all plant cells contain chloroplasts?
No. Many root and other nonphotosynthetic cells do not.
When do sister chromatids separate?
During mitotic anaphase.
What moves during osmosis?
Water across a selectively permeable membrane in response to water potential.
Conclusion and references
The three school diagrams teach structure, division and water movement most effectively when their differences and limitations are clearly explained.
Related school projects: Life Cycle School Project · Science Working Models
References: OpenStax — Eukaryotic Cells; OpenStax — Cell Cycle; OpenStax — Osmosis.
Explore more: 44 school project models, charts and pictures









Share Your Opinion
Comments are closed on this post.