 Vista

Need an Ohm’s Law experiment circuit diagram and V–I graph for a school project? This guide brings together four pictures: the meter arrangement, a battery circuit, a labelled schematic and a voltage–current graph. Students in roughly Classes 9–12 can use them to understand how voltage, current and resistance relate in an ohmic resistor when temperature and other conditions remain reasonably constant. The familiar relation is **V = IR**. The diagrams also show why an ammeter goes in series while a voltmeter goes across the resistor. Only use teacher-approved, current-limited low-voltage equipment; a household wall socket is never part of this experiment. The full-size posters can be viewed through the site’s existing timed image-download page.
What does Ohm’s Law actually say?
Ohm’s Law describes an approximately proportional relationship between the potential difference across an ohmic component and the current through it, provided relevant physical conditions remain steady. The ratio V/I is the resistance R, measured in ohms. As a calculation example, a resistor carrying 0.3 ampere under a 3-volt drop has a resistance of 10 ohms. This is an illustrative value, not a claimed laboratory observation. A diode or ordinary LED does not maintain one constant resistance over all operating conditions, so it should not replace the intended ohmic resistor. Heating can also change the resistance of a real component.
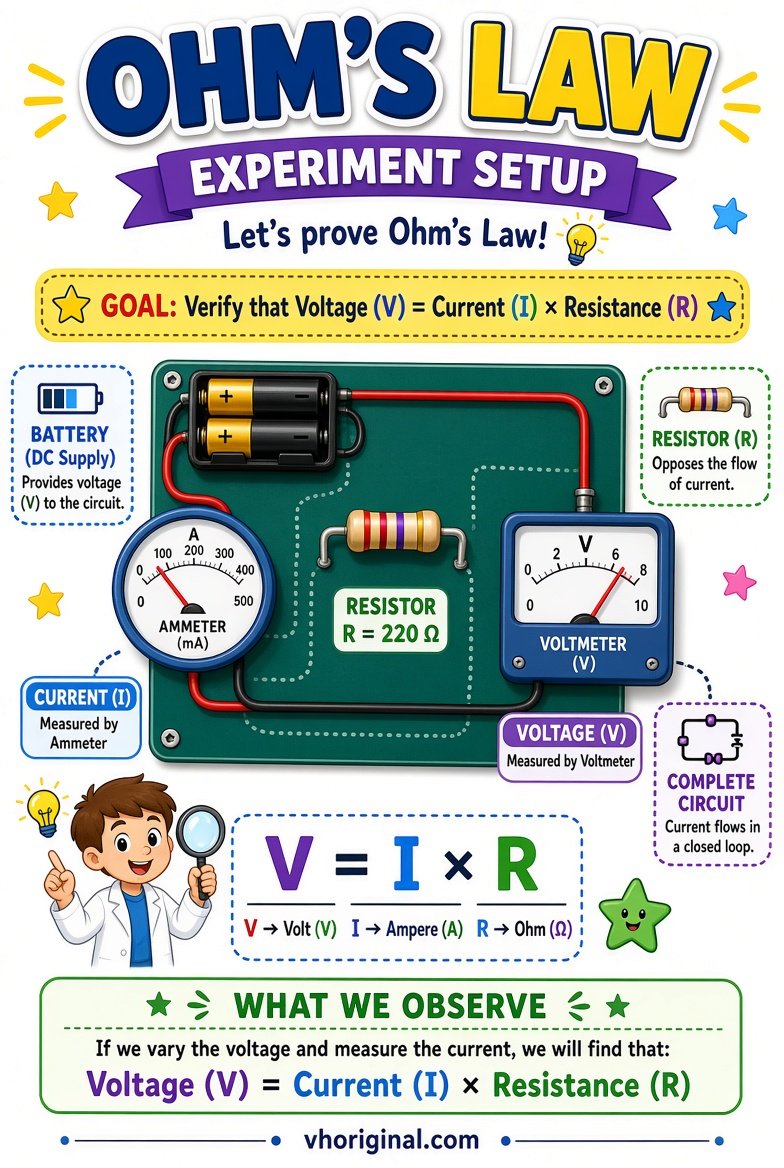
Picture 1: Correct Ammeter and Voltmeter Setup
Connect the ammeter in series with the component whose current is being measured. Place the voltmeter across the resistor, in parallel, so it reads the potential difference between the two resistor terminals. The distinction matters because an ammeter is designed to have low internal resistance, while a voltmeter has high resistance. Connecting an ammeter directly across a battery can cause a dangerous overcurrent and damage the instrument. Check the selected measurement range and meter polarity before closing the circuit. Generated diagrams occasionally reverse the meter positions; verify the setup before following a poster physically.
View / Download after 15-second wait
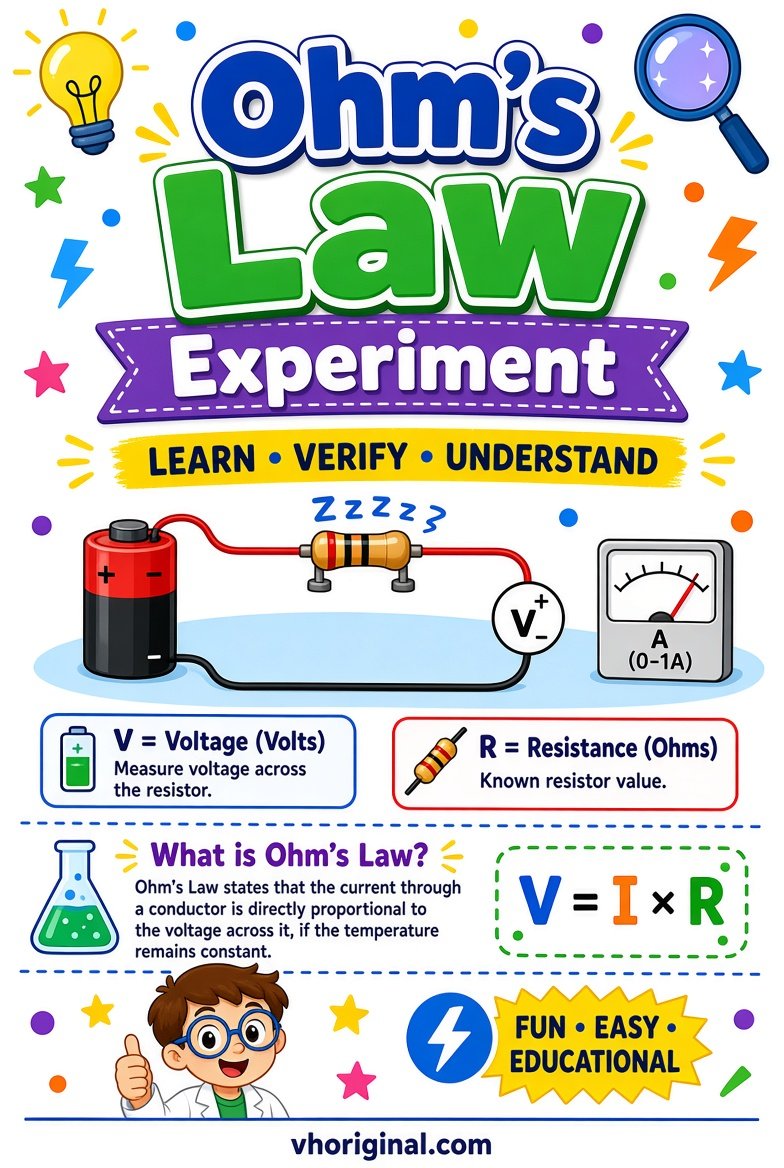
Picture 2: Low-Voltage Battery Circuit
The battery-circuit image helps identify the source, switch, resistor, meter leads and closed path. Assemble everything while the supply is disconnected and the switch is open. An appropriate resistor and a safe, teacher-approved supply limit current. Loose wires, bare contacts and a resistor with too low a value can create overheating or short-circuit problems. Never bridge battery terminals directly with wire, and do not use household mains power to make the experiment ‘stronger’. Read measurements only briefly if the resistor may heat. An adult or instructor should inspect the circuit before students energise it.
View / Download after 15-second wait
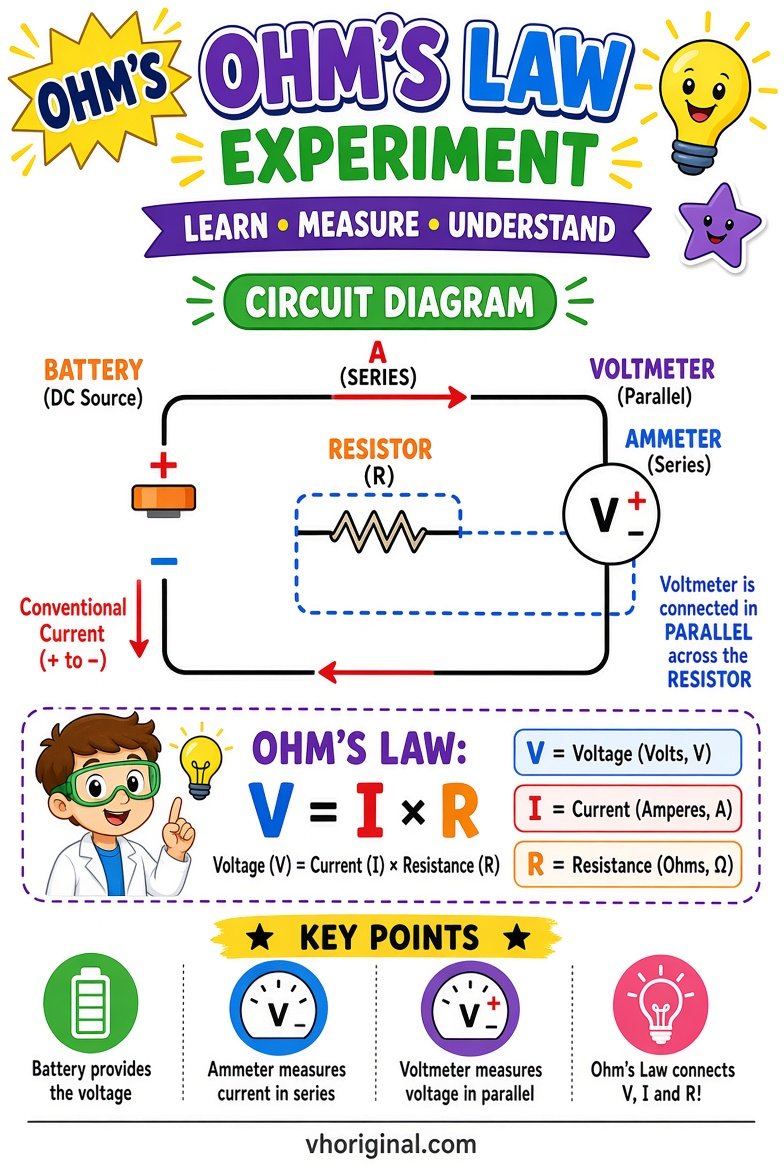
Picture 3: Labelled Circuit Schematic
A schematic uses standard symbols for the source, resistance, switches and measuring devices. Conventional current direction is commonly drawn from the positive supply terminal around the external circuit; electron flow in a metal is in the opposite direction. Draw one main current path through the ammeter and resistor. Draw the voltmeter as an additional branch connected to the two ends of the resistor. If the illustration appears to put an ammeter directly across the source or leaves out a connection, correct the diagram from a textbook. Symbols help communicate the principle; they are not instructions for modifying wiring in the home.
View / Download after 15-second wait
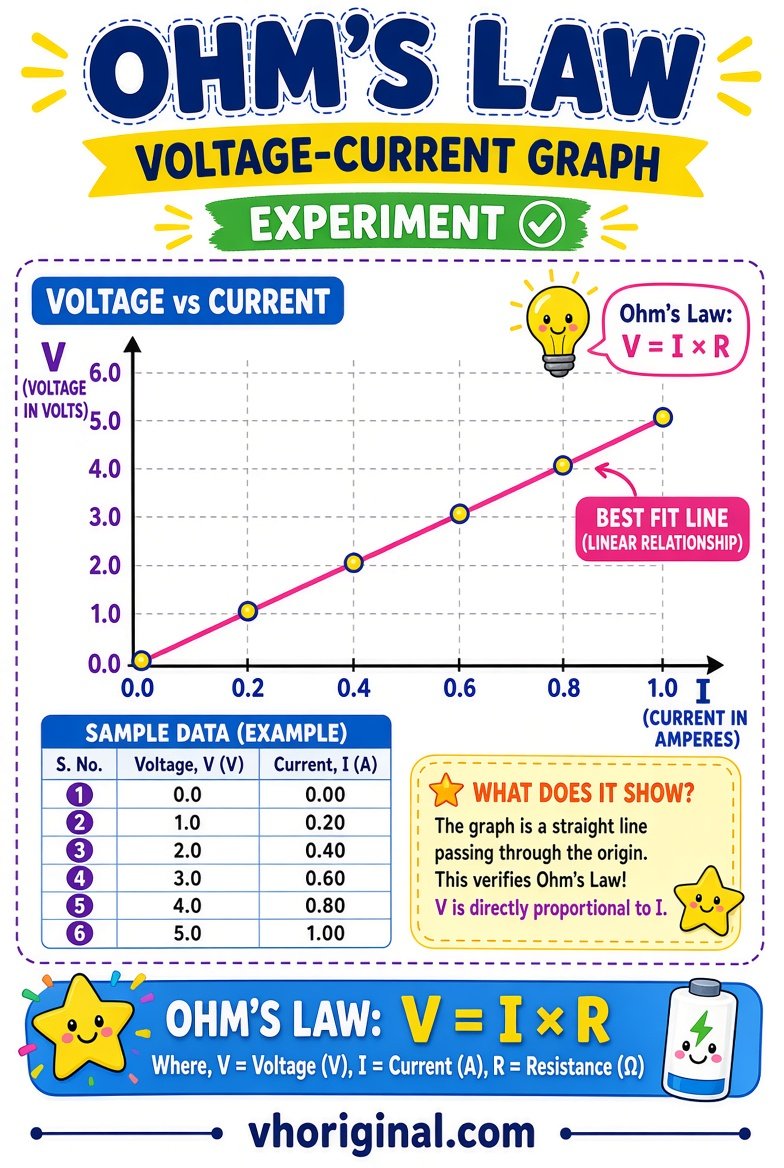
Picture 4: How to Read a V–I Graph
A graph for a resistor that follows Ohm’s Law at constant temperature is approximately a straight line through the origin. Axes determine the meaning of the slope. With voltage V on the vertical axis and current I on the horizontal, slope ΔV/ΔI gives resistance in ohms. If current is on the vertical axis and voltage on the horizontal, slope ΔI/ΔV gives conductance, the reciprocal of resistance. Do not automatically call either slope R. Mark both axis units and place points from genuine observations. Small departures from the ideal line may reflect measurement uncertainty, poor contacts or temperature changes.
View / Download after 15-second wait
Materials and a Useful Observation Table
A typical supervised kit contains an appropriate low-voltage source, resistor, switch, connecting leads and correctly rated ammeter and voltmeter. Some classrooms use a protected variable supply or digital multimeters configured for the required measurement. Prepare columns for Voltage (V), Current (A) and Resistance (Ω). Calculate R = V/I for nonzero currents and compare values, allowing for measurement error. Check the distinction between milliamperes and amperes before calculating; confusing them changes results by a factor of one thousand. Never present invented readings as if you performed the experiment. A sample table should be clearly labelled as illustrative.
Step-by-Step Practical Procedure
Sketch the circuit before handling equipment. Place the ammeter and voltmeter as specified, leaving the switch open. Let the teacher check connections and instrument ranges. Apply a safe low voltage briefly and record the displayed values. If an adjustable approved supply is available, take additional readings without heating the resistor excessively. Turn the power off after each sequence. Plot your readings on graph paper with consistent scale and units. Determine the slope only after confirming which quantity belongs on each axis. Compare the resistance values and consider sources of error rather than forcing observations into a predetermined perfect line.
Viva Questions, Mistakes and Image Downloads
Explain why an ammeter is in series, a voltmeter is parallel, and what the V–I slope means for the chosen axes. Not all materials remain ohmic at all temperatures. Never short or overheat a circuit. Posters retain the existing 15-second advertisement-supported image page; use its normal Download action and verify labels before hand-drawing.
Frequently asked questions
What is Ohm’s Law?
For an ohmic component under suitable conditions, V = IR.
Where is the ammeter connected?
In series with the resistor being tested.
Where is the voltmeter connected?
Across the resistor in parallel.
Does the V–I graph slope always equal resistance?
Only when voltage is plotted vertically against current horizontally; reversed axes give 1/R.
Conclusion and references
A strong Ohm’s Law project combines correct wiring, careful measurements and a properly labelled graph with explicit safety limits.
Related projects: Wind Turbine LED Model · Robotics and LDR Models
Scientific references: OpenStax — Ohm’s Law; OpenStax — Meters.
Explore more: 44 school project models, charts and pictures










Share Your Opinion
Comments are closed on this post.