 Vista
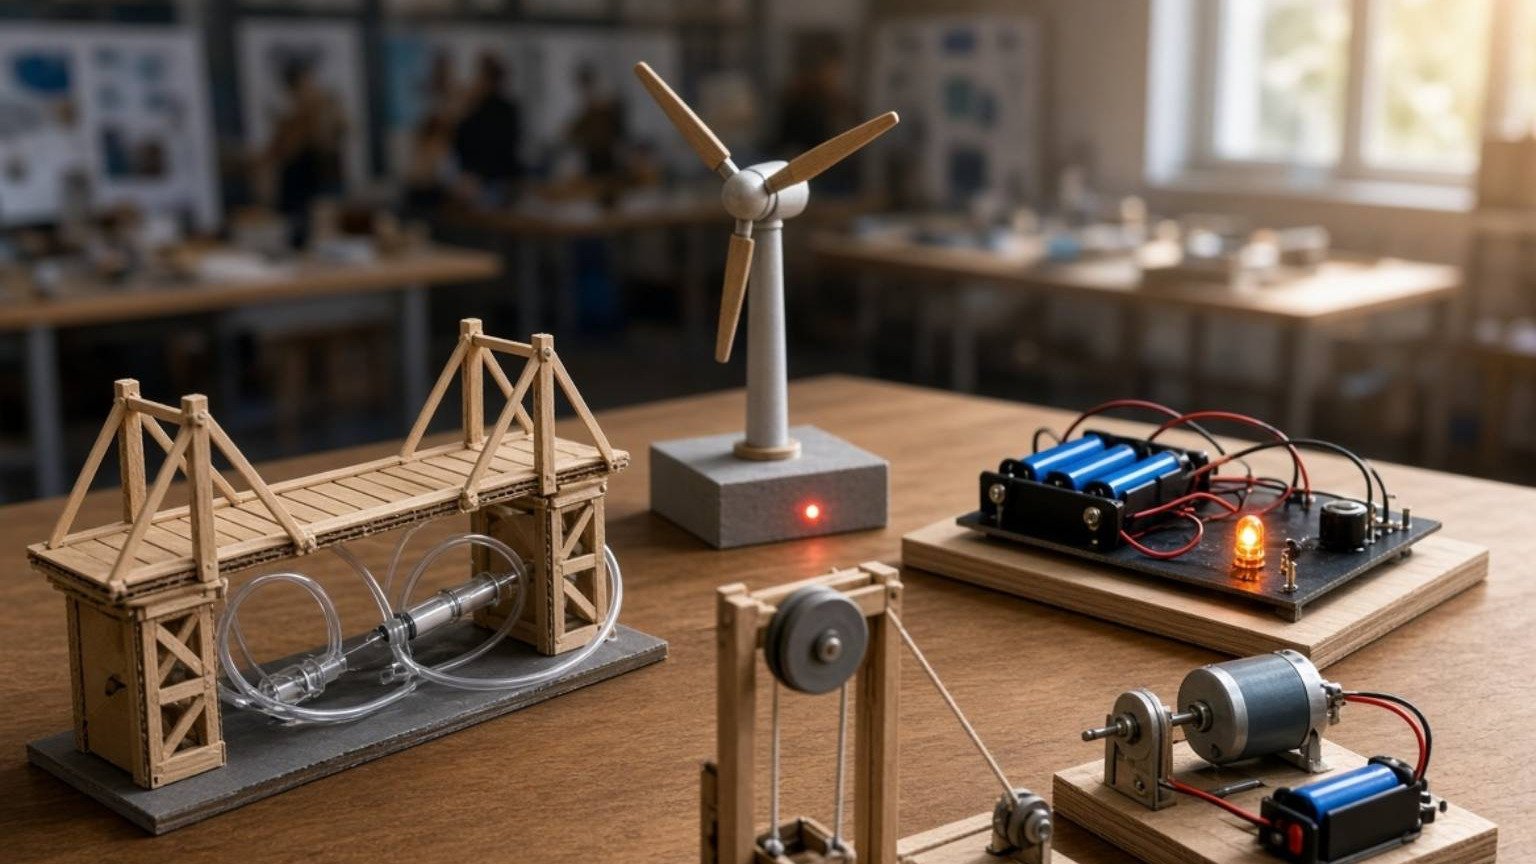
Need a sound vibration school project with pictures? This guide pairs a Frequency and Amplitude Model with a Resonance Tuning Fork Experiment. The two posters explain how vibrating objects create mechanical disturbances, how frequency relates to pitch and why some objects respond strongly when driven near a natural frequency. Students in approximately Classes 6–11 can use the charts for a science exhibition, classroom presentation or safe supervised experiment. A sound wave requires a material medium such as air, water or a solid; ordinary mechanical sound cannot travel through a vacuum. Keep all demonstrations at a comfortable volume and never strike a tuning fork near anyone’s ear. Both images retain the site’s existing 15-second image-download route.
How do vibration and sound relate?
A vibrating object can disturb a surrounding material. In air, ordinary sound travels as a longitudinal pressure wave involving compressions and rarefactions. The air particles oscillate around local positions while the disturbance carries energy onward. A familiar sine curve is a useful representation of pressure variation with position or time, but it does not mean the air particles themselves necessarily travel vertically along the drawn line. A ruler, string, drum surface and tuning fork are different possible sources of vibration. Ask students to distinguish the moving source from the medium carrying the wave before comparing frequency or amplitude.
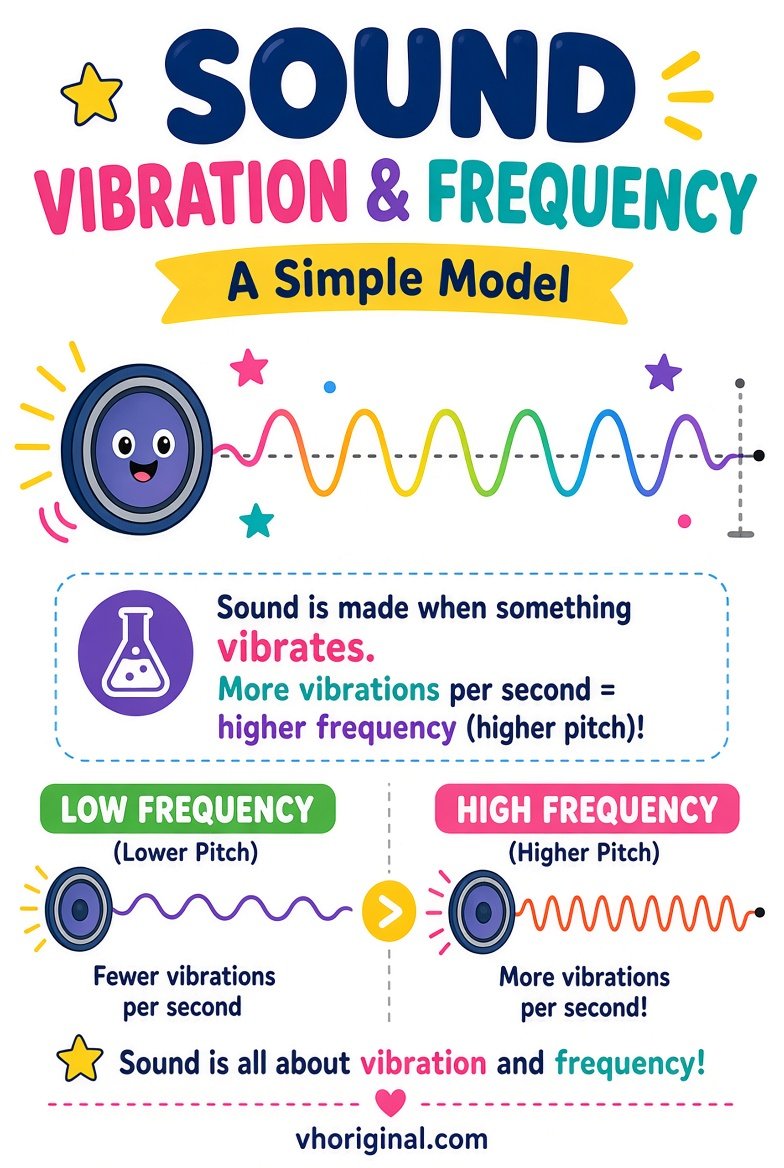
Picture 1: Sound Vibration Frequency Model
Frequency is the number of complete oscillations per second, measured in hertz (Hz). Increasing sound frequency generally raises perceived pitch. Amplitude describes the size of an oscillation and can be related to sound pressure and intensity, though perceived loudness also depends on frequency, distance and human hearing. A graph with closely spaced peaks shows more cycles within the same interval than one with widely spaced peaks. To compare frequencies fairly, keep the time scale identical between drawings. Avoid telling pupils that a taller wave always has a higher pitch; height and spacing represent different quantities in these simplified graphics.
View / Download after 15-second wait
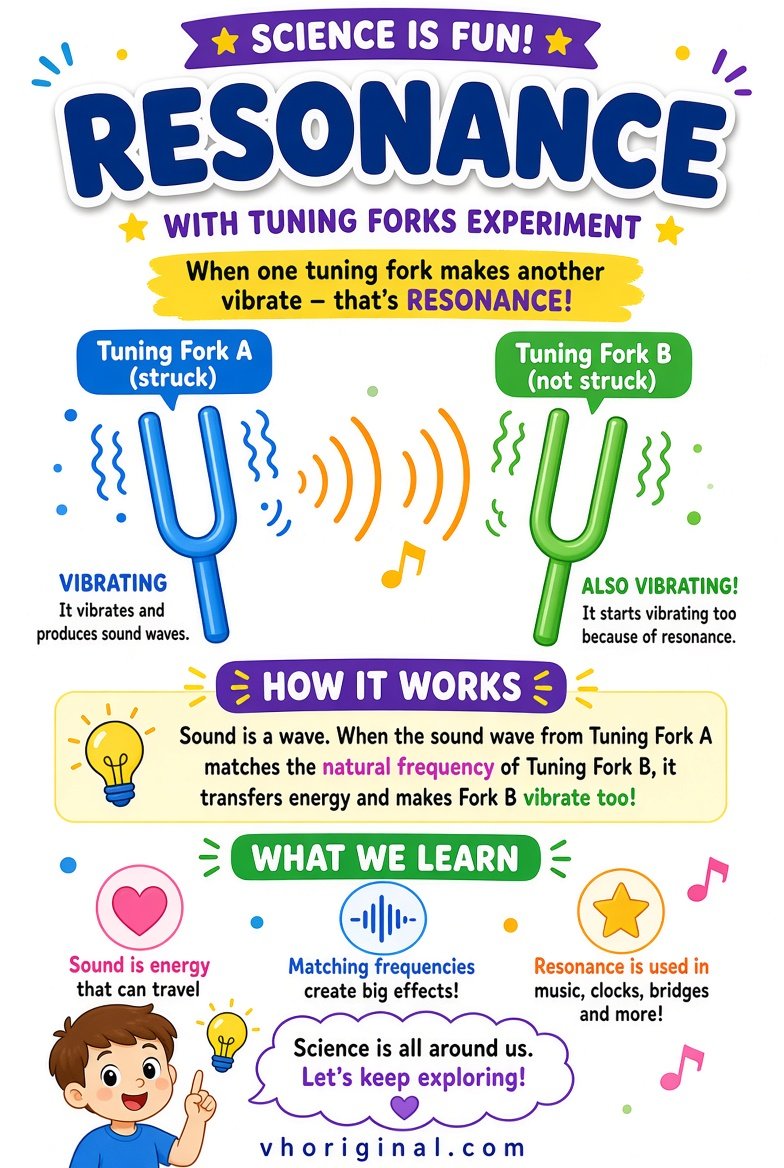
Picture 2: Resonance Tuning Fork Experiment
A tuning fork has two prongs that vibrate after the fork is struck gently with an appropriate rubber striker. It creates a relatively pure sound compared with some everyday instruments. Resonance can occur when a system receives periodic forcing near one of its natural frequencies, leading to a greater oscillation amplitude under suitable conditions. Two similarly tuned forks or a suitable resonance box can help illustrate this response. Frequency match alone is not a guarantee of dramatic movement; coupling, damping and distance also affect the result. Never strike a fork on glass or metal edges, and keep it away from ears and faces.
View / Download after 15-second wait
Why sound needs a medium
Mechanical sound is transmitted through interactions among particles in a substance. Air can transmit pressure disturbances, and sound can also travel through water or solids with different speeds and wave modes. A vacuum lacks the material particles needed for ordinary sound propagation. A chart can show groups of particles displaced slightly around their resting positions, making it easier to explain compressions and rarefactions. It should not show the same parcel of air travelling all the way from the speaker to the listener. Do not invent exact speeds for different media without checking suitable measurements and conditions, such as temperature.
Pitch, amplitude and perceived loudness
Pitch is strongly associated with frequency, whereas perceived loudness depends on acoustic intensity and how human hearing responds to the sound. A high-pitched tone is not automatically louder than a low-pitched tone. A vibrating drum can become more forceful when struck harder without changing its natural frequencies in the same proportion. For a helpful A4 display, draw two waves with different frequencies at similar amplitude, then another pair with different amplitude at similar frequency. Label the horizontal time scale consistently. These comparisons are conceptual; their drawn shapes do not provide calibrated sound levels or an actual measured frequency.
Safe materials for a classroom project
Use chart paper, coloured pencils, ruler, cardboard, soft rubber bands and a lightweight plastic ruler. A classroom may also have a laboratory tuning fork and a rubber striker, both used according to instructor instructions. Small supervised ruler vibrations can be shown without electronics, dangerous volume or expensive equipment. A resonance experiment may simply be explained through its poster when proper equipment is unavailable. Do not use high-powered loudspeakers, very loud smartphone tones or headphones at excessive volume just to prove a point. Keep everyone comfortable and end the test if the sound causes discomfort.
Step-by-step wave chart and tuning fork presentation
Begin with two wave drawings on the same time scale. Count the cycles to show which has higher frequency, and label the unit Hz rather than inventing a numeric reading. Next draw a vibrating tuning fork, its prongs and sound-wave arrows. Explain that the frequency of the driving disturbance may match the natural frequency of another system. If approved lab equipment is available, let the teacher demonstrate a gentle strike and note any observable vibration or sound. Do not claim that resonance occurred unless the response is actually observed under the chosen setup. Finish with a short explanation of the model’s limitations.
Viva questions, image access and safety
Be ready to answer what frequency measures, what happens to pitch when frequency rises and why resonance does not occur strongly for every pair of objects. A further question is whether ordinary sound can travel through empty space; it cannot. Sound intensity should not be increased to a harmful level in order to demonstrate vibration. Open either full-size poster through the existing 15-second advertisement-supported download page and use its normal View or Download action. Avoid direct file-download shortcuts. Before copying a generated graph, check that amplitude, wavelength and frequency labels actually represent the intended quantities.
Frequently asked questions
Why does sound need a medium?
It is a mechanical disturbance transmitted through material particles.
What is frequency measured in?
Hertz (Hz), meaning cycles per second.
Does higher frequency always mean a louder sound?
No. Frequency mainly relates to pitch, not simply loudness.
When does resonance occur?
A strong response can occur when forcing approaches a system’s natural frequency under suitable conditions.
Conclusion and sources
An effective sound and resonance school project separates pitch from loudness, identifies the medium and uses safe vibration demonstrations instead of excessive volume.
Related school projects: Simple Machines Models · Mechanical Working Models
References: Physics Classroom — Forced Vibration; Purdue Physics — Tuning Fork Resonance.
Explore more: 44 school project models, charts and pictures











Share Your Opinion
Comments are closed on this post.