 Vista
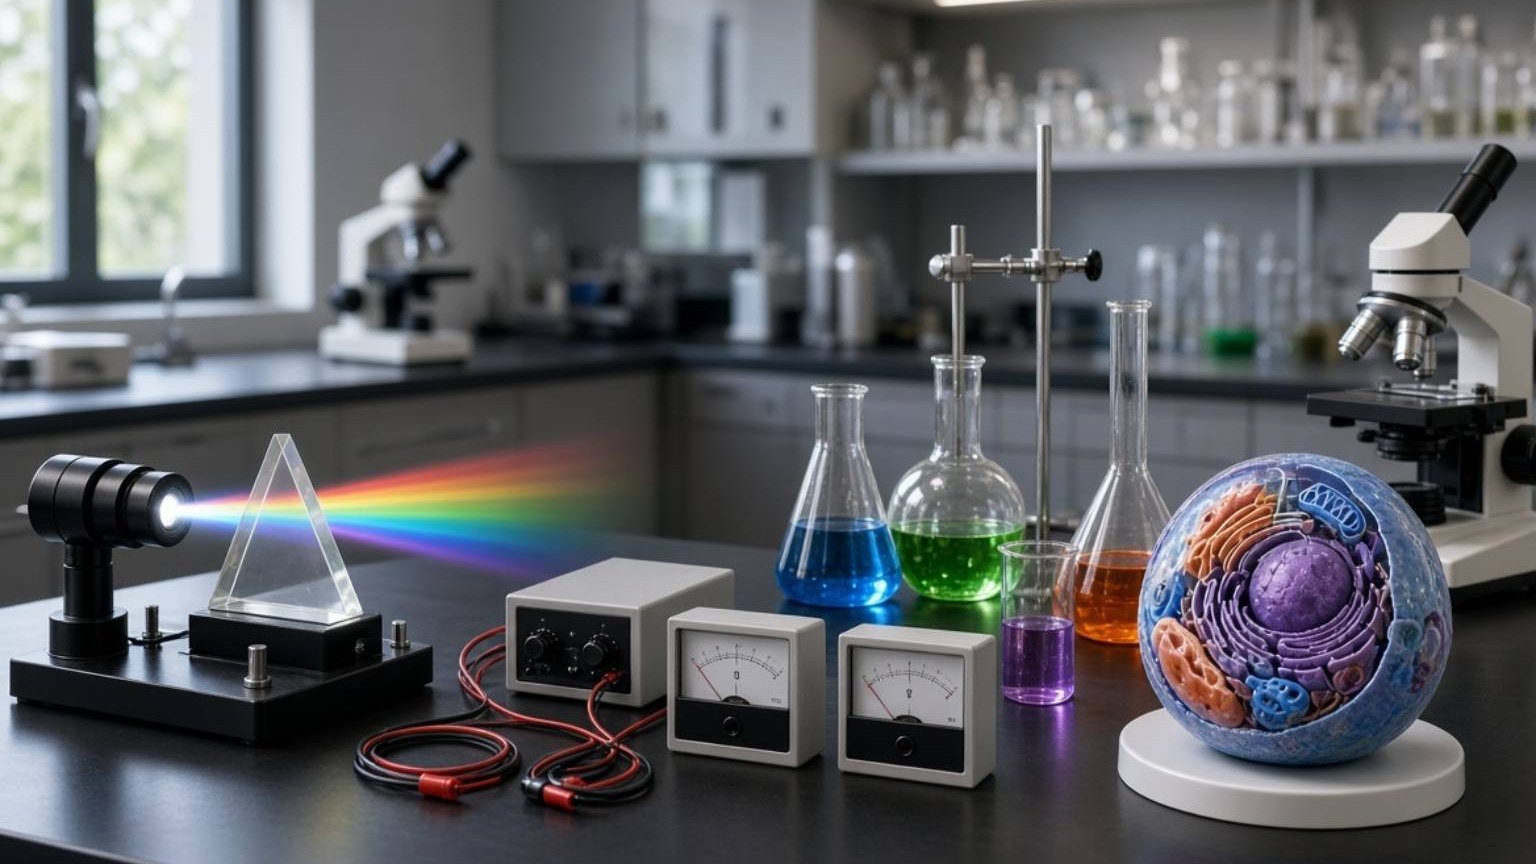
Need a light refraction school project with diagrams and steps? This page brings together five pictures: a simple water experiment, a labelled ray diagram, a working transparent-block model, an observation chart and a Newton colour disc. They can support an A4 science chart or class activity for roughly Classes 6–10. Refraction concerns light changing direction when crossing between suitable transparent materials. A colour disc is a related activity about visual colour mixing, not a direct example of light bending at a boundary. Each image uses the site’s existing 15-second advertisement-supported View and Download route. Never direct a laser or intense light toward eyes.
What is Refraction of Light?
Light changes speed when it crosses boundaries between materials with different optical properties. At oblique incidence this typically changes the direction of its path. When a ray enters ordinary glass or water from air, it generally bends toward the normal. When it exits back to air, it generally bends away from the normal. At exactly normal incidence, the direction remains straight although the propagation speed changes. A partly submerged pencil can seem displaced at the water surface because the rays reaching our eyes take different paths. Refraction is not simply a matter of the water physically bending the pencil.
Picture 1: Easy Water Refraction Experiment
Place a pencil in a transparent container of clean water and view it from the side. Its underwater portion may appear shifted or kinked relative to the part in the air. The pencil remains straight; the visual appearance depends on ray paths at the water boundary. Students can draw what they see and compare with the scientific explanation. Younger pupils do not need powered optics equipment. In a supervised laboratory, a suitable ray box and transparent block can offer more controlled observations. Use a stable container and avoid broken glass or spills. Never improvise with a high-powered laser or look into a light source.
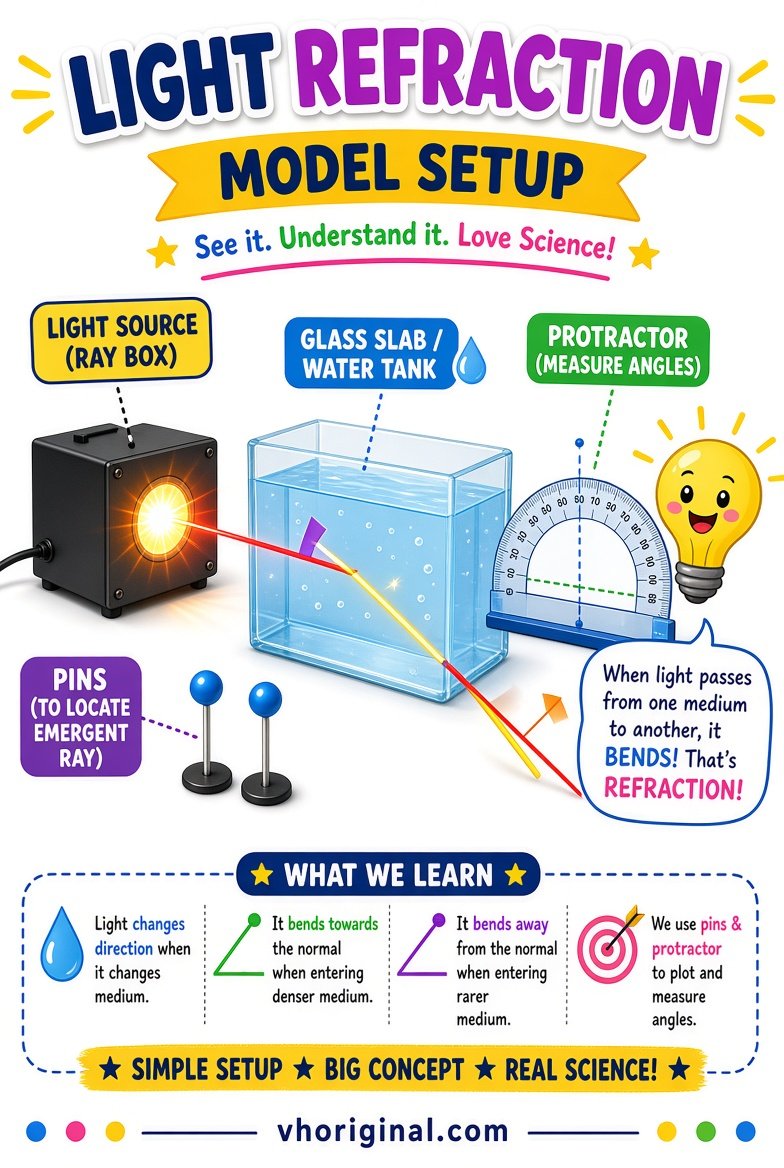
View / Download after 15-second wait
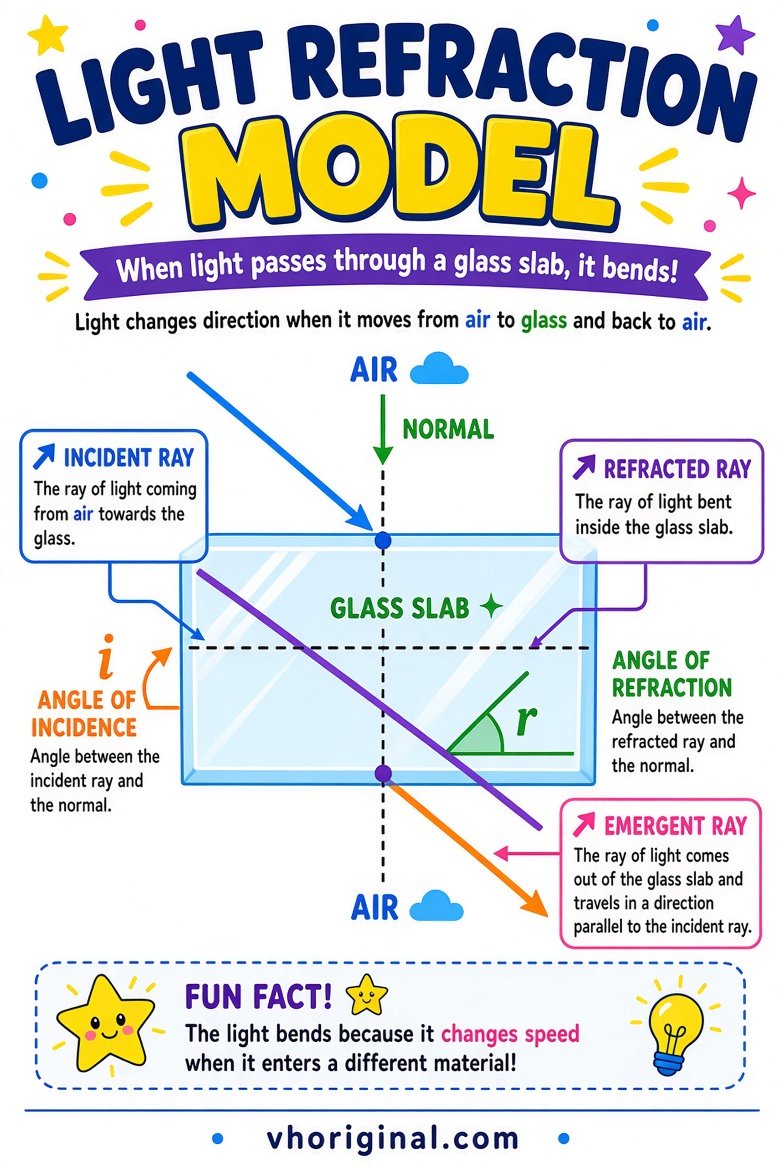
Picture 2: The Normal, Incident and Refracted Ray
The normal is an imaginary line perpendicular to the interface at the point where the ray arrives. Incidence and refraction angles are measured from this normal rather than from the surface itself. The incident ray approaches the boundary, and the refracted ray continues into the second material. For an oblique air-to-glass path the refracted ray usually lies closer to the normal. The arrow direction and medium labels must agree with the diagram. If a generated poster draws the normal at the wrong angle, its apparent measurements become misleading. Check the geometry before using it as a school reference.
View / Download after 15-second wait
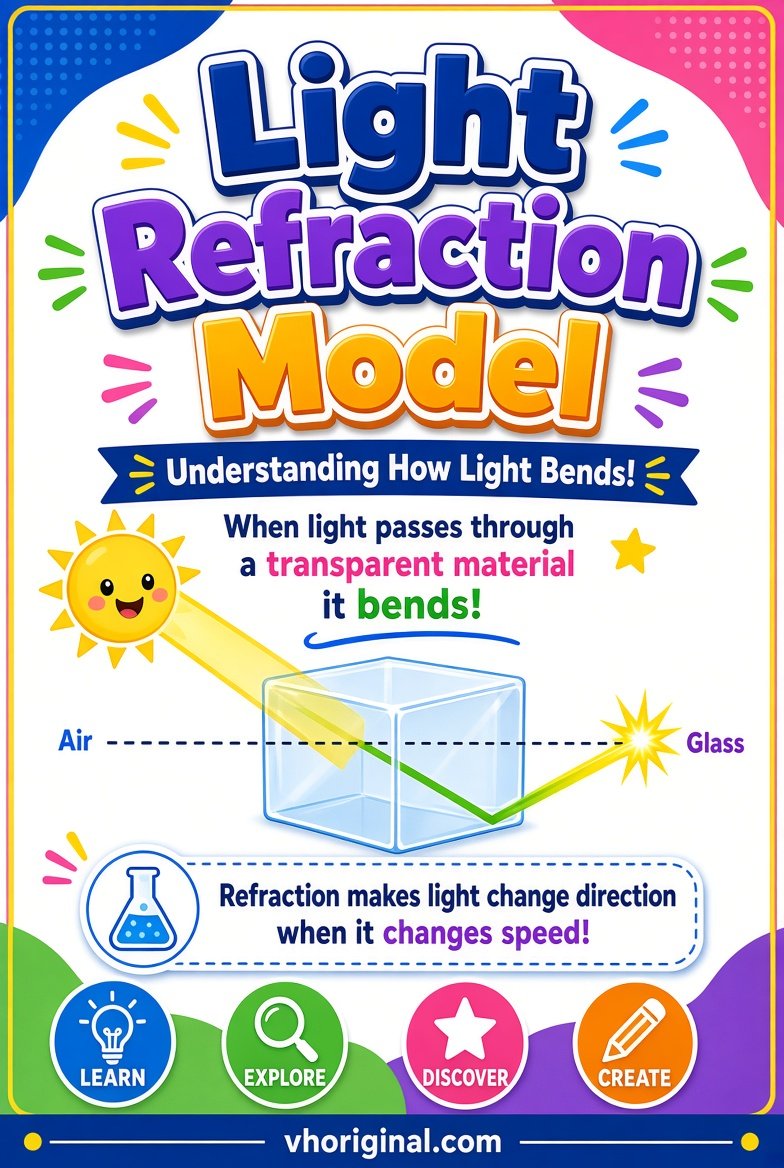
Picture 3: Transparent Slab Working Model
A rectangular slab generally has parallel faces. A ray entering at an angle refracts once on entry and again on exit. If it begins and ends in the same surrounding material, the emergent ray is commonly parallel to the original incident direction, though shifted sideways. This sideways offset is called lateral displacement. A triangular prism behaves differently because its faces are not parallel and it may disperse different colours by different amounts. Students should not label a prism as a rectangular slab or assume all transparent objects produce identical paths. A paper diagram can communicate these ideas without needing an expensive glass kit.
View / Download after 15-second wait
Picture 4: An Observation Chart with Real Values
Use a protractor to measure angle i between the incident ray and the normal, and angle r between the refracted ray and the normal. Snell’s law relates these angles to material properties. Suitable classroom data may be organised under Medium, Incidence Angle, Refraction Angle and Observation. Actual measurements can differ slightly from ideal predictions because of alignment and reading errors. Do not fabricate measurements and present them as experimental results. If the assignment is only a drawing, label the table as an illustrative example. Keep angular units in degrees and check that each recorded value refers to the correct medium.
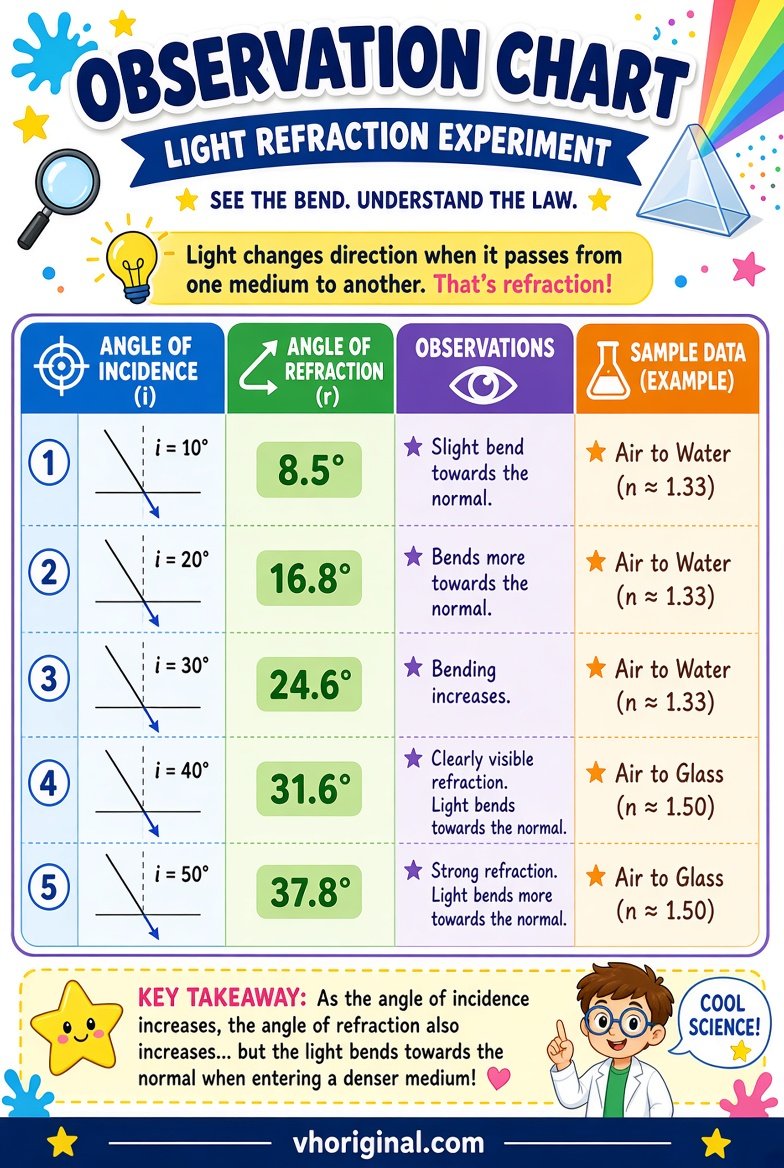
View / Download after 15-second wait
Picture 5: Newton Colour Disc Experiment
A Newton colour disc is divided into sectors painted with different colours. When the disc turns rapidly, the eye can integrate the successive coloured views and perceive a pale, greyish or whitish mixture. The exact effect depends on printed pigments, proportions, lighting and rotation speed. An ordinary paper disc is not guaranteed to become perfectly pure white. This experiment demonstrates temporal visual mixing and should not be described as exactly reversing every aspect of prism dispersion. Construct the wheel from lightweight cardboard and use a safe manual spinner. Avoid exposed metal points and high-speed motors around children.
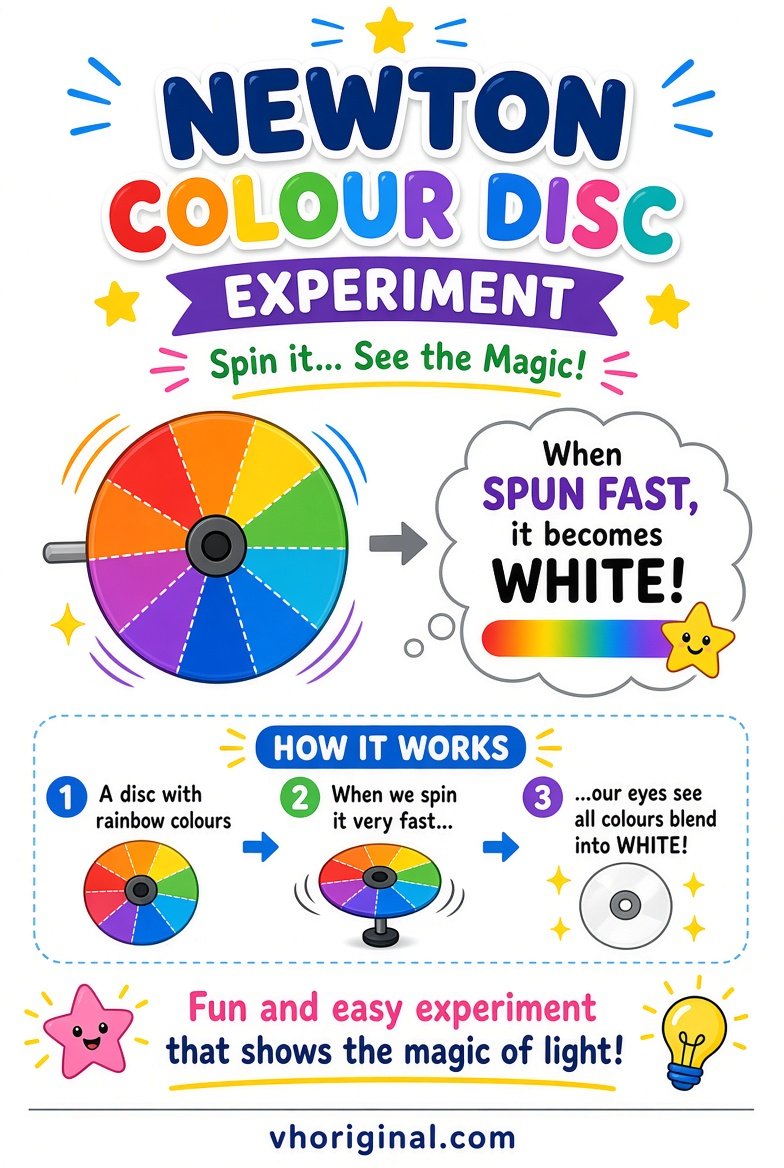
View / Download after 15-second wait
Materials and Step-by-Step Chart Making
Prepare clean A4 paper, pencil, ruler, protractor, coloured pens, a water container and optional safe transparent block. Draw a flat boundary and a normal perpendicular to it. Add an incident ray pointing toward the boundary and a refracted ray consistent with the two materials. Place angle labels relative to the normal. In another panel draw the two faces of a rectangular slab and its emergent ray. Use a third paper disc for the colour-mixing activity if assigned. Large labels are better than excessive decoration. Ask students to explain why the pencil appears bent even though it is physically unchanged.
Viva, Safety and Image Downloads
Explain refraction angles measured from the normal, bending at a boundary and why the Newton disc demonstrates visual mixing rather than refraction. Never aim bright beams into eyes; keep water away from electricity. The existing 15-second advertisement-supported download page remains active for each poster. Check incident, emergent and normal lines before copying a generated diagram.
Frequently asked questions
Where are incidence and refraction angles measured from?
From the normal, a line perpendicular to the boundary.
What happens when light enters glass obliquely from air?
It generally bends toward the normal.
Does light change direction at normal incidence?
No, though its speed may change.
Will a Newton disc always look perfectly white?
No. The mixed appearance depends on printing and viewing conditions.
Conclusion and references
The most useful optics projects separate ray refraction, actual angle measurement and visual colour mixing while keeping diagrams safe and accurate.
Related school projects: Solar System 3D Model · Hydraulic Bridge
References: The Physics Classroom — Refraction; NCERT — Science.
Explore more: 44 school project models, charts and pictures








Share Your Opinion
Comments are closed on this post.