 Vista
Looking for ecosystem school project models with clear pictures? This visual guide groups six connected topics: Food Web Connections, a Food Chain Diorama, Pond and Desert Ecosystems, a Mangrove Habitat and a chart of Indian wildlife and IUCN Red List categories. The posters help students in roughly Classes 5–10 explain how living organisms interact with food, water, climate and places to live. Every chart has a full-size image link and a short description. You will also find safe cardboard model steps and classroom presentation tips. The diagrams are teaching illustrations, not field surveys; species and feeding links should be checked against reliable educational sources before being copied.
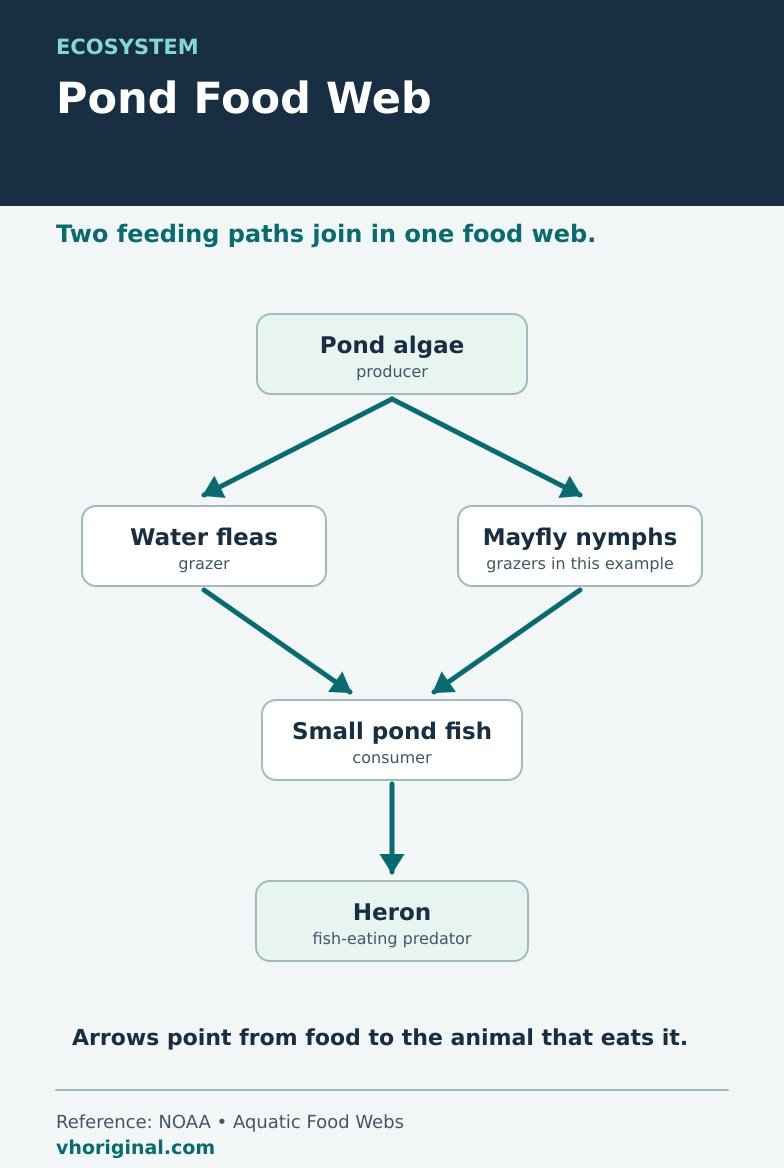
Picture 1: Food Web Connections Diagram
A food web often begins with producers such as plants or algae that use light to manufacture food. Consumers obtain energy by eating producers or other organisms. Many animals have more than one food source, so the connections form a web rather than a straight line. Explain the arrows carefully: if a rabbit eats grass, the arrow showing energy transfer goes from grass toward rabbit. Check every relationship in an illustrated diagram; the direction of a beautifully drawn arrow can still be wrong.
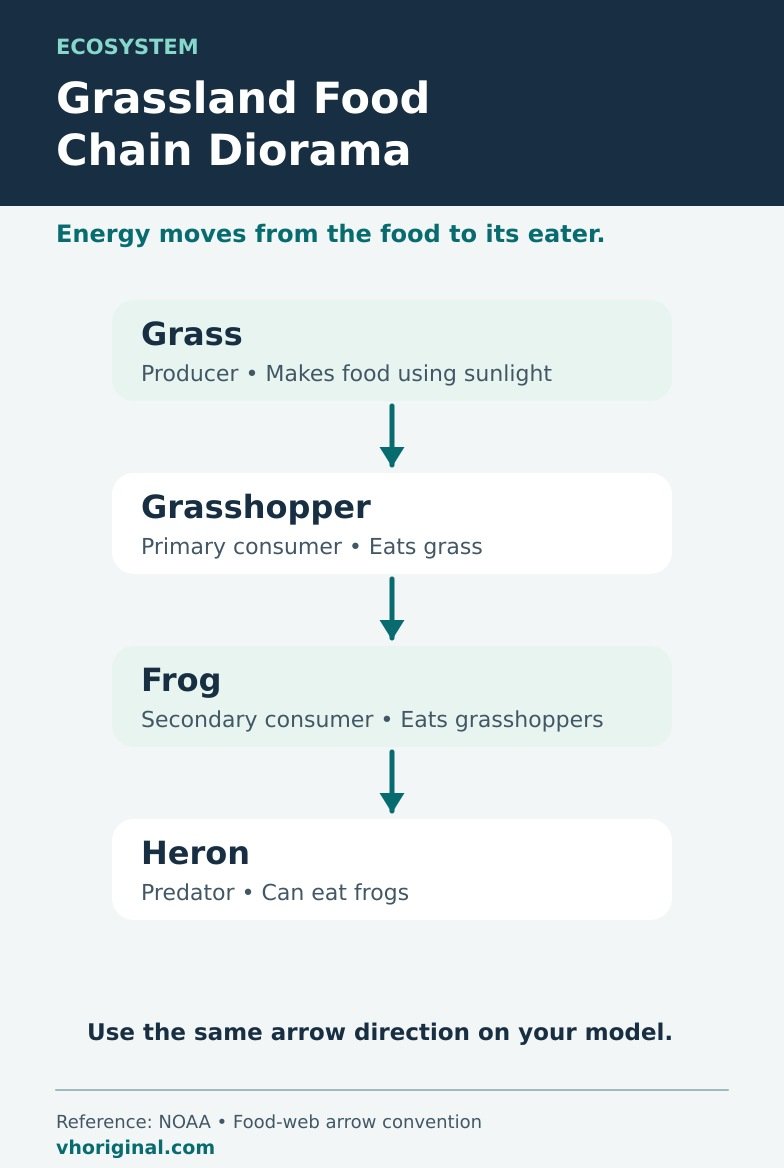
Picture 2: Food Chain Diorama Model
A diorama is a small three-dimensional scene. Use a cardboard base with paper grass, an appropriate plant-eater and a plausible predator to demonstrate one food chain. Do not assume any predator in a generic poster eats every herbivore. Add thick paper arrows that visitors can read from a classroom desk. Decomposers can be discussed separately as organisms helping break down organic material. Actual carcasses, pond water or messy waste have no place in a children’s model.
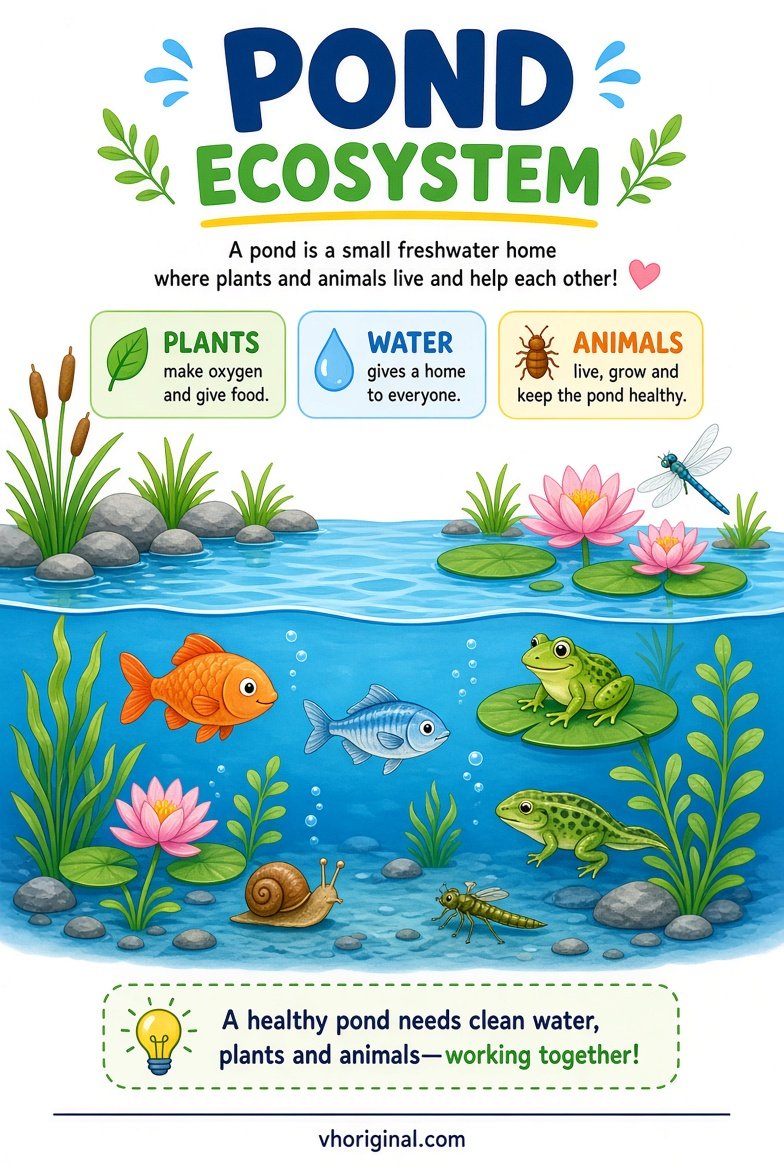
Picture 3: Pond Ecosystem Diorama
A pond may contain aquatic plants or algae, insects, fish, microorganisms and other species. Some organisms live close to the surface, some in the water column and some at the edges. Not all ponds contain the same fish, frogs or turtles. For a classroom model, use blue paper for water and cut-out plants around a shallow cardboard container. Do not collect unidentified pond water, living creatures or potentially contaminated mud for the display. The focus should be interactions, not the number of figurines.
Picture 4: Desert Ecosystem Diorama
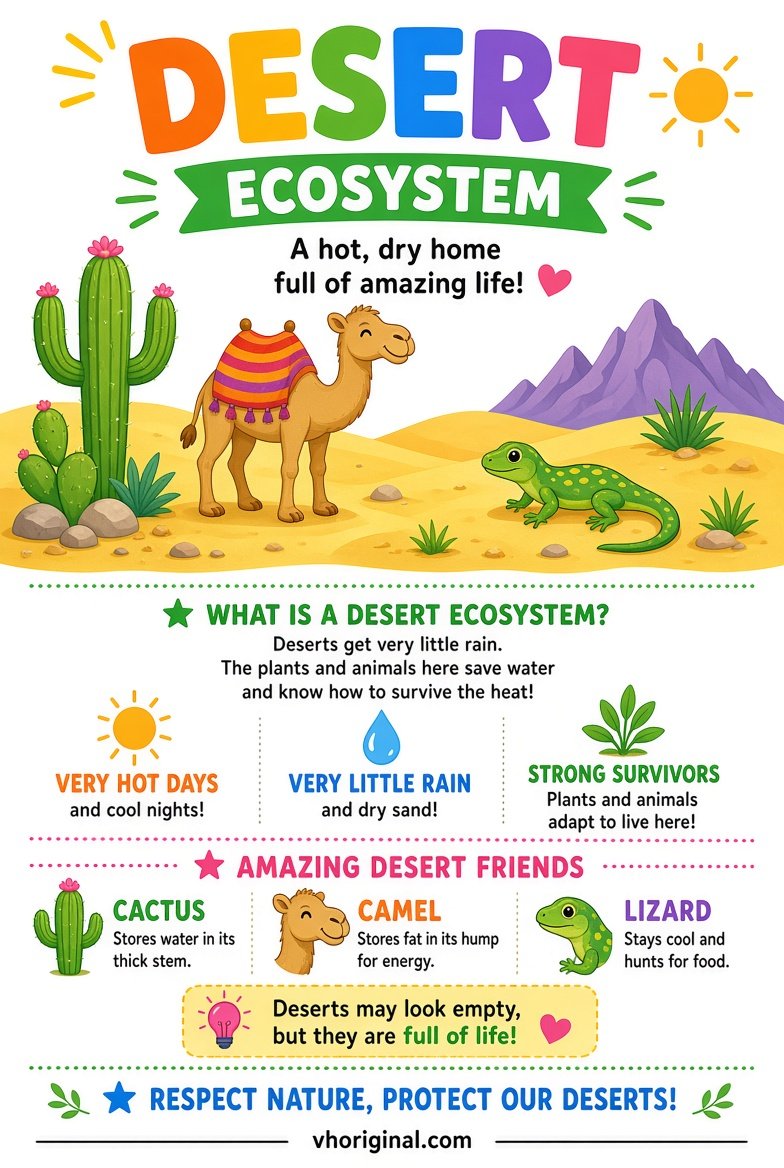
Deserts are defined by dry conditions, not solely by sand dunes. Some have stony or gravelly landscapes and organisms adapted to limited water availability. Plants and animals differ between deserts, so an illustration may show general adaptations rather than local species. Avoid claiming that every desert is hot at all times or that every desert animal is nocturnal. A simple landscape model can introduce adaptation, habitat and the importance of water without overstating the science.
Picture 5: Mangrove Ecosystem Poster
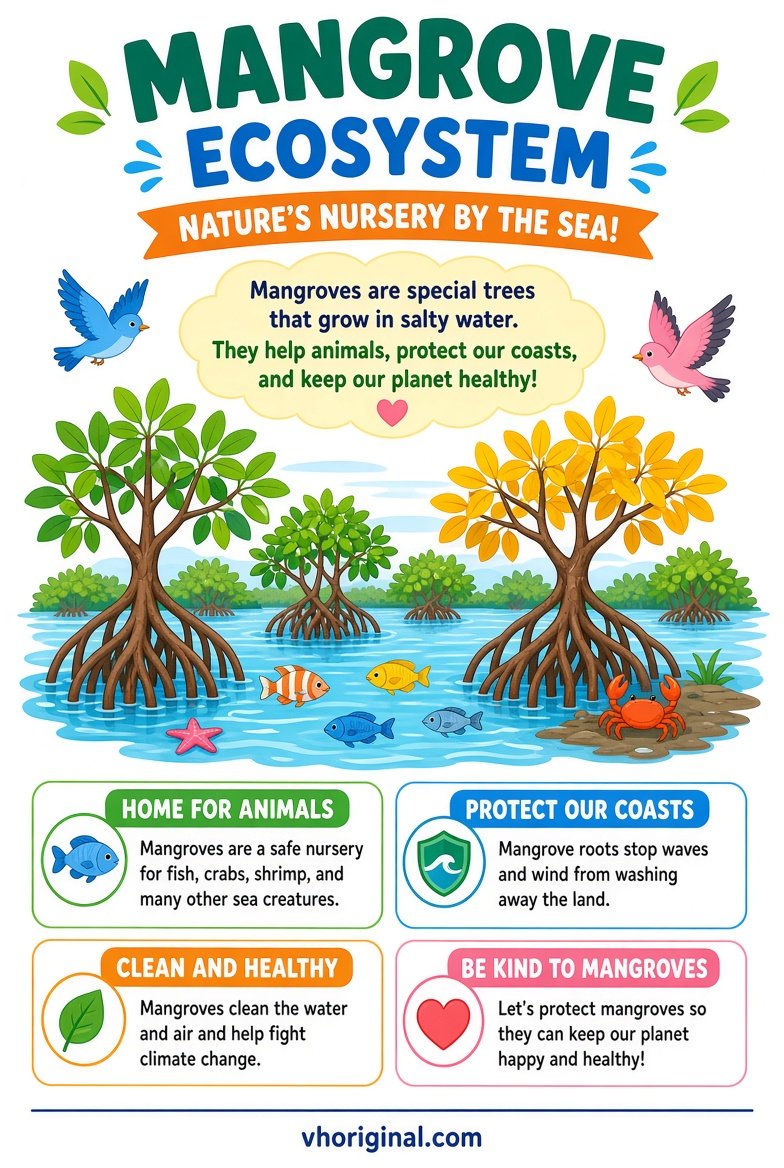
Mangroves are trees and shrubs associated with coastal tidal environments. Some have specialised roots that help them survive waterlogged or salty conditions. These areas can provide shelter and nursery habitat for fish, crabs and other creatures. Label coastal water, the root zone and representative wildlife in your poster. Root structures and associated species differ; not every mangrove tree looks alike. Use paper roots and a blue sheet to show the water level without removing plants from a real coastal habitat. Explaining why the habitat is valuable is more important than building a perfect miniature forest.
Picture 6: Wildlife of India and IUCN Red List Status
The poster compares global IUCN Red List categories for four named species. Tigers and Asian elephants are Endangered. The greater one-horned rhinoceros is Vulnerable, and the Indian peafowl is Least Concern. Categories apply to the species assessed, so a picture of one rhinoceros cannot represent every rhino species. The chart gives conservation categories without showing geographic ranges. A global category is separate from a species’ legal protection in India.

Materials and step-by-step construction
A sturdy base, clean cardboard, coloured paper, pencil, ruler and safe glue are enough for a strong presentation. Decide whether the assignment is a single food-chain scene or a comparison of habitats. Sketch the layout, add carefully chosen plants and animals, then label producers, consumers and non-living conditions. Draw food-web arrows with a short note explaining what they represent. Keep the pond, desert and mangrove sections distinct rather than combining them into one biologically impossible scene. Finally ask a student to explain one relationship and one environmental condition in each habitat.
Presentation questions, safety and image downloads
Students might be asked how a food web differs from a chain, what makes a desert dry, or why mangrove roots can look unusual. Answer using the pictures and avoid unverified claims about species. Tap a poster to open its full-size image and use your browser’s Save Image option. If the school requires hand-drawn work, use the charts as references rather than finished assignments. Do not catch wildlife, disturb nests or handle questionable water samples. An accurate explanation is more valuable than a crowded, ornate diorama.
Frequently asked questions
What is the difference between a food chain and a food web?
A chain shows one pathway of energy transfer; a web connects several possible pathways.
Which ecosystem model is easiest for Class 6?
A pond ecosystem or a simple food-chain diorama works with a few well-labelled components.
Are all deserts made of sand?
No. Many desert landscapes also contain stone, gravel or other surfaces.
What does an IUCN Red List category tell us?
It describes global extinction risk for a species at the time of assessment. It does not identify local populations or their range.
Conclusion and references
An effective ecosystem school project uses pictures to show relationships among organisms, habitats and conservation instead of treating every wildlife illustration as a verified ecological survey.
Related school projects: 8 Easy Science Working Models · Easy Tree Drawing
References: NOAA — Aquatic Food Webs; National Geographic — Food Web.
Related project: carbon and nitrogen cycle diagrams
Sources: IUCN • Tiger · IUCN • Asian elephant · IUCN • Greater one-horned rhino · IUCN • Indian peafowl · State of India’s Birds • Indian Peafowl


Share Your Opinion
Comments are closed on this post.