 Vista
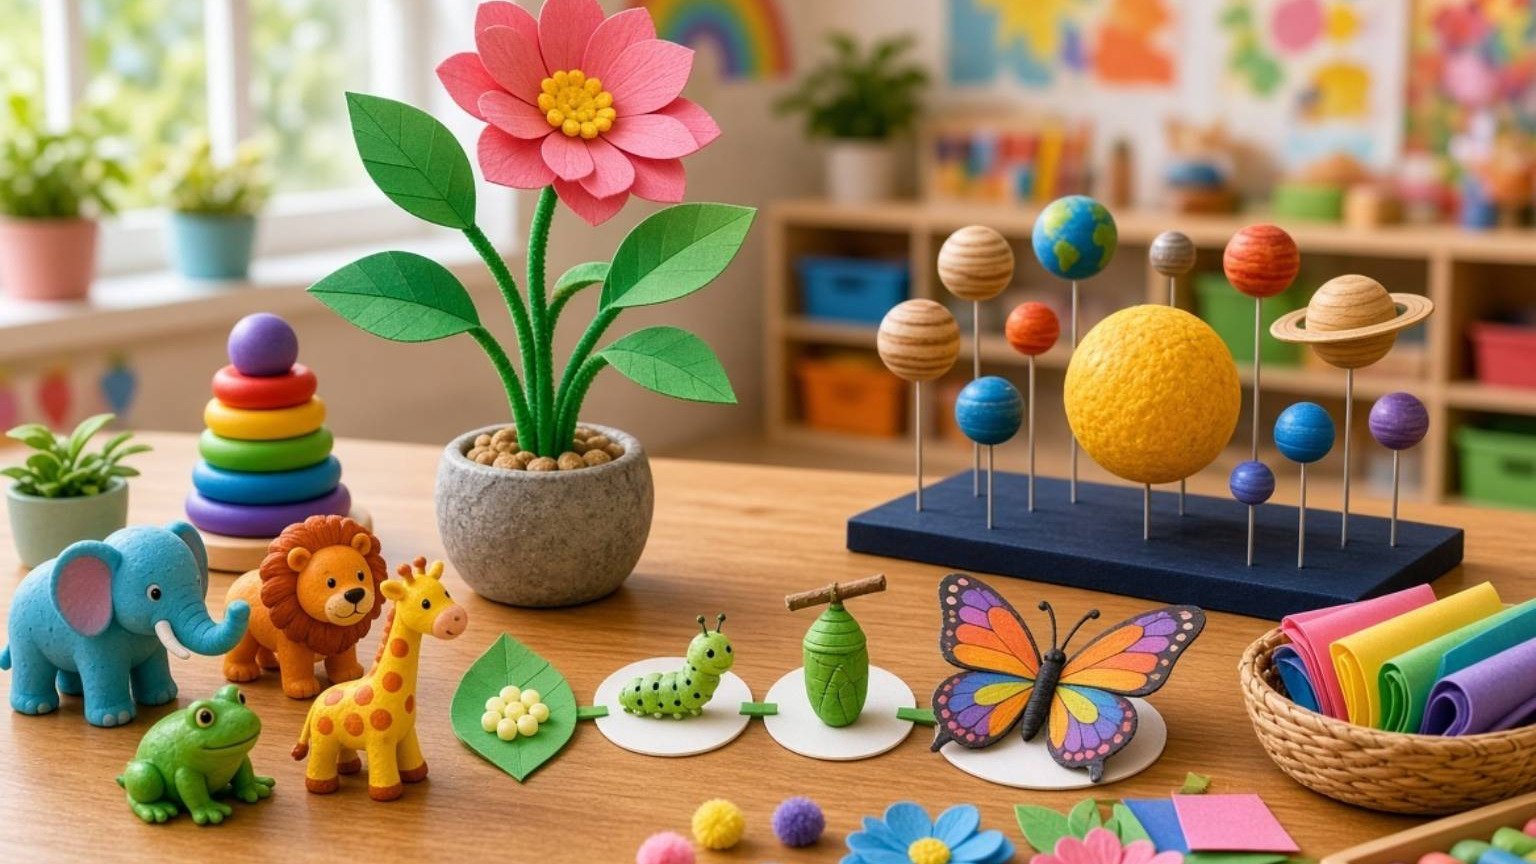
Looking for EVS charts for school projects that children can actually understand? This picture-based guide brings together three primary-school favourites: Five Senses, Living and Non-Living Things, and Parts of a Plant. Each chart has a full-size image link, a short explanation, materials for a simple A4 project, and practical ideas for classroom presentation. The aim is not to reproduce a colourful picture perfectly. It is to help students identify things around them, compare examples, and explain what they have learned in their own words. These activities can be simplified for Class 1 or expanded for Classes 3–5.
Why use picture-based EVS school projects?
Environmental learning begins close to home: a sound heard outside, a plant growing near the window, or a familiar object in a classroom. Pictures help a child notice shapes and categories, but a picture by itself does not establish understanding. Ask a question about the poster and then find a matching real-world example. A teacher might show a drawing of an ear and ask children to identify the sound of a bell. Similarly, a plant diagram becomes easier when students observe a leaf on a real plant. Keep charts focused on one theme rather than crowding unrelated subjects onto a single sheet.
Chart 1: Five Senses for Kids
The five familiar senses are sight, hearing, smell, taste and touch. Eyes help us see light and colour, ears detect sound, the nose senses odours, the tongue helps detect taste, and sensory receptors in the skin contribute to touch. Explain each with a safe classroom example: spot a green pencil, listen to a soft bell, or feel the texture of a clean cloth. Children should never be asked to taste unknown materials or directly inhale unfamiliar chemicals. For small learners, one clear image and one example per sense are usually enough. Older pupils can describe the sense organ and the information it helps them notice.
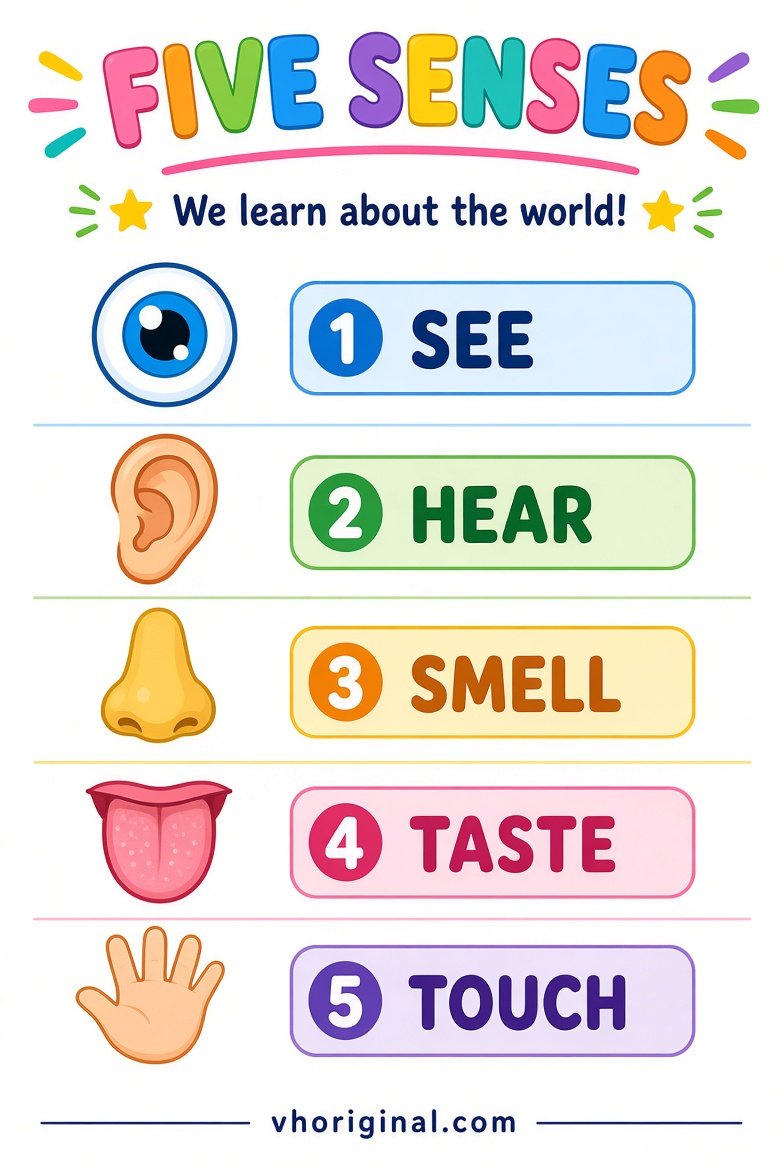
Chart 2: Living and Non-Living Things
Living things carry out processes associated with life. A growing plant and a dog are familiar living examples, while a chair and a stone are non-living. Movement alone is not a reliable test: a toy car can move without being alive, and a tree remains rooted while it grows and responds to its environment. Use a two-column chart with everyday examples, then ask what each item needs and whether it can grow or reproduce. Students may encounter tricky examples such as seeds, fallen leaves or wood. Handle these carefully; avoid teaching that every moving object is living or that every still object is non-living.
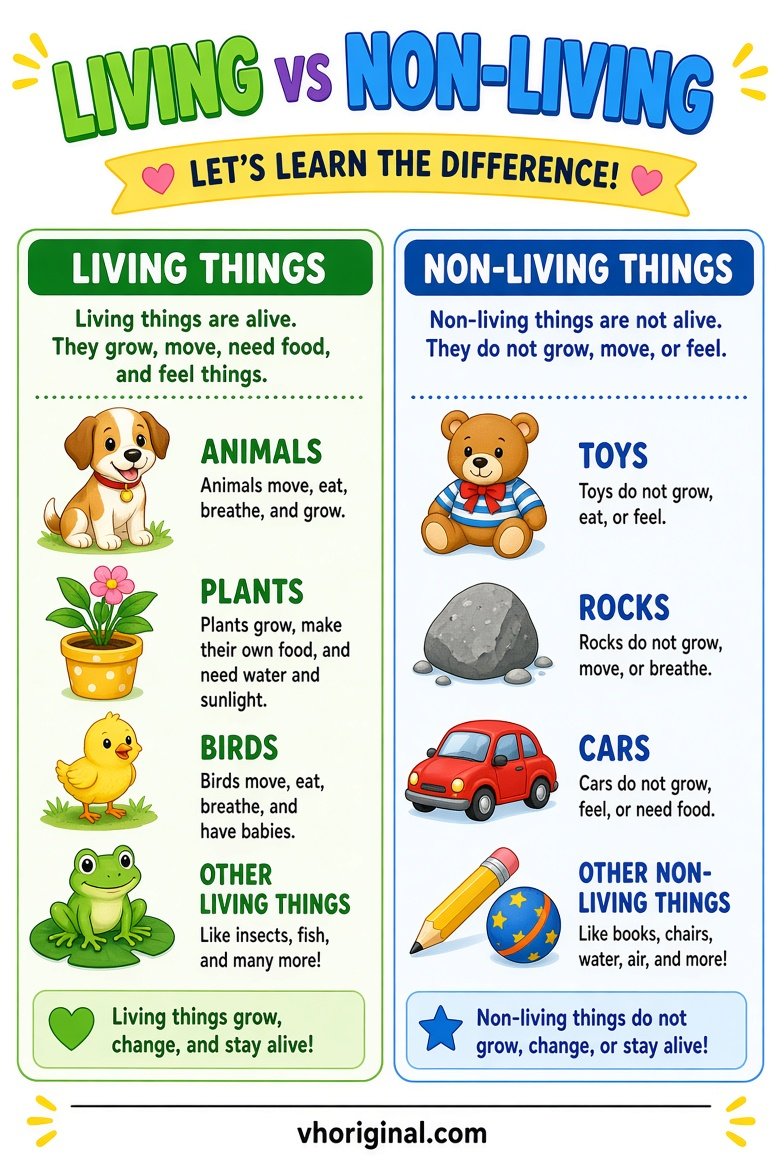
Chart note: Use several signs of life together. A non-living object can still move because of wind or change because of weather.
Chart 3: Parts of a Plant
A simple flowering-plant diagram often labels roots, stem, leaves and flower. Roots anchor the plant and absorb water and minerals. The stem supports leaves and transports materials through the plant. Green leaves are important sites of photosynthesis, the process through which plants make sugars using light. Flowers are involved in reproduction in flowering plants. Not all plants show exactly the same visible parts, so treat the poster as a teaching example rather than a universal blueprint. Observe a potted plant without unnecessarily uprooting it; a separate drawing can illustrate the root system hidden below the soil.

Materials for a simple A4 school chart
Use plain paper or an A4 sheet, a pencil, ruler, eraser, colour pencils and a few markers. Glue and a printout are optional if the school permits printed pictures. Plan the layout before colouring: a title at the top, the drawing at the centre, and two or three short explanation lines underneath. Labels should be large enough to read from a classroom desk. Leave space between arrows and the picture so it is clear which structure each label identifies. Do not make the background so decorative that the information becomes difficult to read.
Step-by-step: make and explain the three charts
First, choose one of the three subjects according to the teacher’s instructions. Second, sketch the main objects or organs lightly in pencil. Third, organise examples into an easy structure: five separate senses, two comparison columns, or a labelled plant. Fourth, add colours that make the important objects distinct rather than hiding them. Fifth, check every label against the lesson book. Sixth, add your name, class and subject if the assignment requires them. Finally, practise a short explanation without reading each word aloud. This last step is especially useful: it shows whether a child can connect the picture with an experience or observation.
Presentation ideas and common errors
A good presentation can follow three sentences: “This is my topic. These pictures show its main parts. Here is a real example.” With the senses chart, the example could be seeing a colour or hearing a bell. With living things, compare a plant with a toy vehicle. With the plant chart, point to a leaf and explain its role. Common mistakes include calling all moving objects living, claiming that roots make all the plant’s food, and using tiny or incorrect labels. The student does not need to copy an illustrated poster exactly; a clear hand-drawn version is often better for learning.
Frequently asked questions
Which EVS chart is easiest for Class 1?
Five Senses and Living vs Non-Living charts work well with a few simple examples and bold pictures.
Can Class 4 and 5 students use the same images?
Yes. Add more accurate labels, observations and brief explanations instead of extra decoration.
How can I save a full-size project image?
Open the link below the chart, then use your browser’s image-saving option.
Is a printed chart better than a hand-drawn one?
Follow the teacher’s requirement. A hand-drawn chart can help a child practise identification and labelling.
Conclusion and source
Use the charts as starting points for observation rather than as answers to memorise. A short, accurate explanation in the child’s own words makes the project much more valuable.
Reference: NCERT Primary EVS Learning Outcomes — https://ncert.nic.in/pdf/publication/otherpublications/tilops101.pdf
Related project: seed germination and life cycle charts





















Share Your Opinion
Comments are closed on this post.