 Vista
Looking for an India map school project with pictures? This visual guide offers three distinct resources: an India map drawing, a Physical Features Relief Map and an Indian Monsoon Formation Model. Together they introduce mapping skills, major landforms and the broad movement of moisture-bearing winds. Students in roughly Classes 5–10 can use each full-size poster to prepare an A4 chart or a lightweight cardboard display. A crucial caution: an illustrated map is not an official source for political boundaries. Check the latest Survey of India maps where appropriate. The monsoon also involves larger atmospheric circulation rather than being simply a giant daily sea breeze.
Use the Survey of India political map or the official outline map for the actual boundaries. The three project posters avoid drawing political lines.
What is different about these three geography projects?
An outline map helps locate India, its states or selected places. A relief map focuses on landforms and relative elevation, while a monsoon diagram depicts broad atmospheric pathways and seasonal rainfall. These are three separate questions. A student asked to label states should not substitute an unlabelled mountain model; someone assigned physical geography should not fill the page only with capital cities. When combining the topics, use headings and legends rather than placing every possible label on one map. Clear typography and an appropriate map source are more useful than complicated decoration.
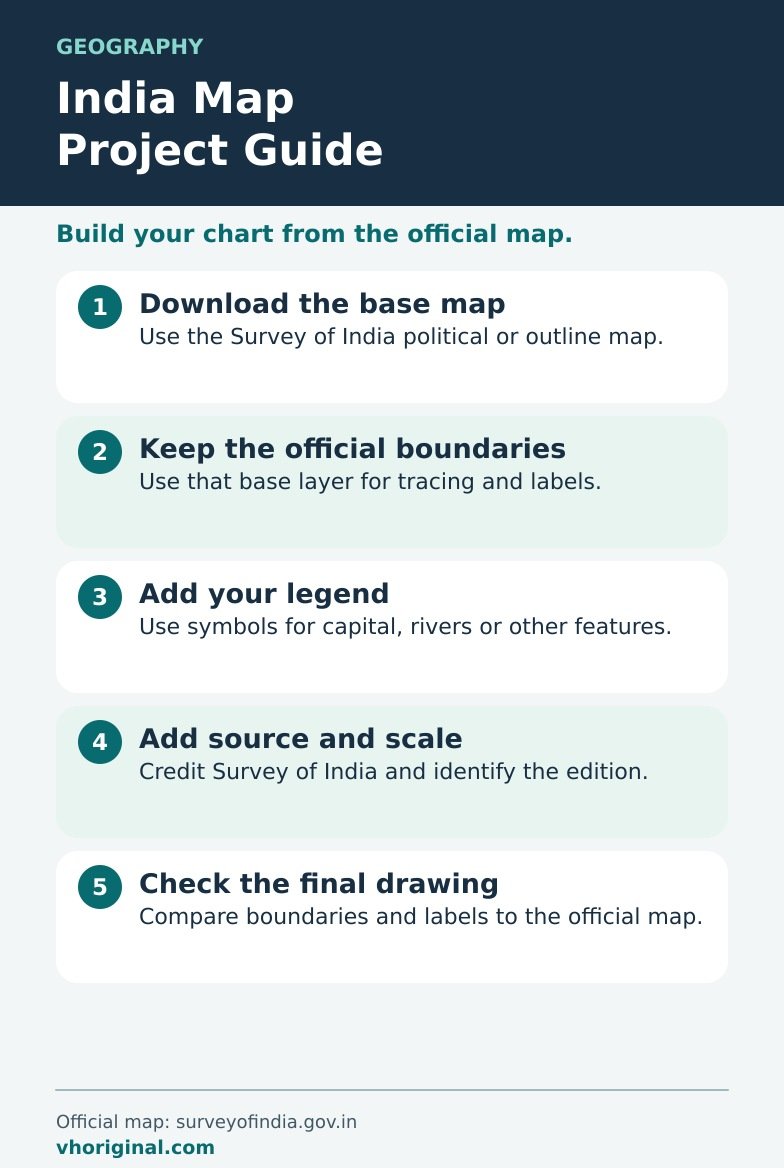
Picture 1: India Map Drawing
Begin with a carefully copied outline on plain A4 paper. Check orientation, coastline and political boundary labels against a suitable official map. Mark the north direction and add a simple legend if colours represent regions. School posters or automatically generated images may contain outdated states or distorted borders, so do not treat an attractive illustration as a boundary authority. Survey of India materials and a current approved textbook are sensible references. If your teacher requests only an outline, keep the layout spare. When the task requires state names, use enough space to keep them readable rather than forcing every name inside a tiny area.
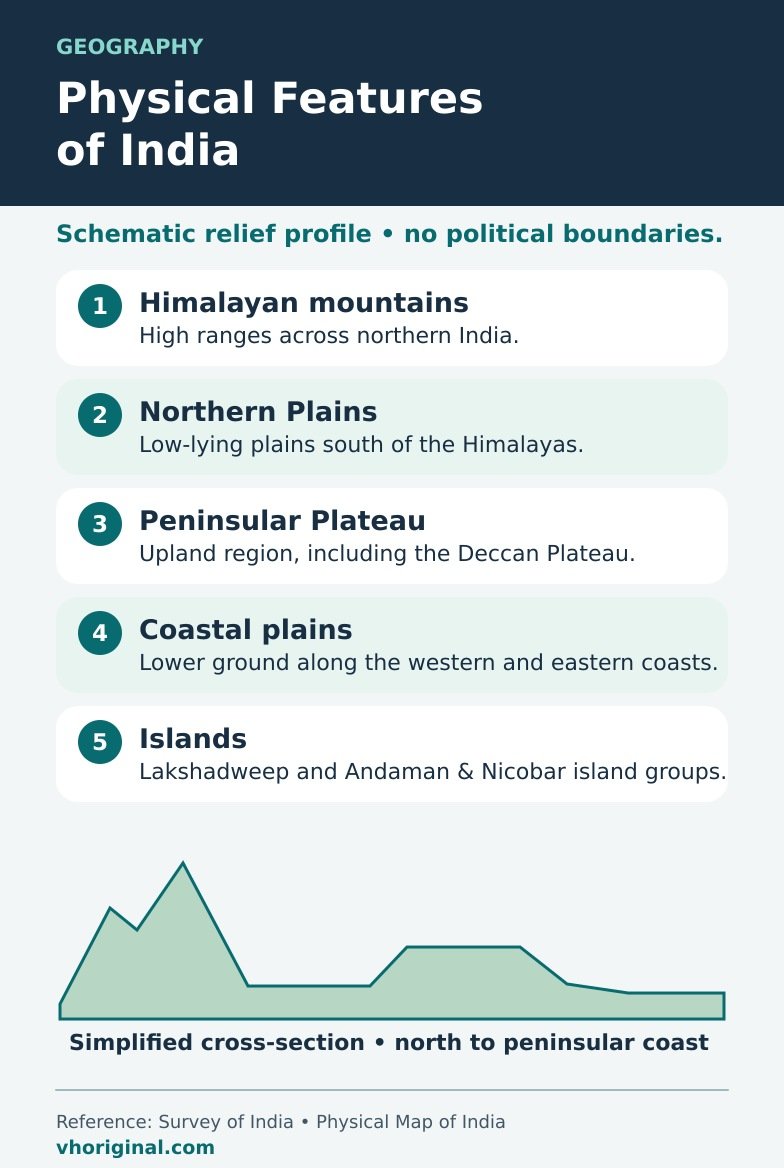
Picture 2: Physical Features of India Relief Map
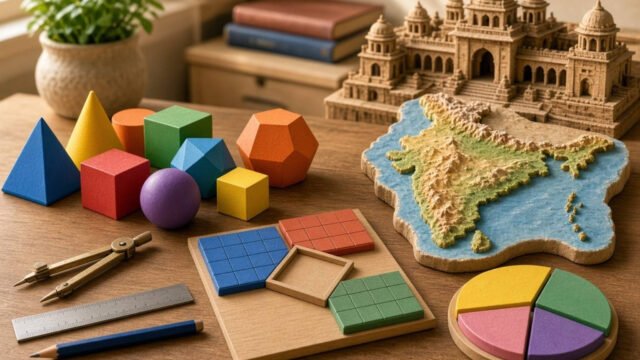
Major physical divisions include the Himalayas, Northern Plains, Peninsular Plateau, Indian Desert, coastal plains and islands. A cardboard relief model can represent high mountain land using layered paper, plateaus using lower raised shapes and plains using a flat base. The thickness of paper does not represent real elevation unless a meaningful scale is used. Include a legend explaining what the colours mean. Physical regions have complex boundaries and should be checked against a geography textbook. A model is an approximation that introduces landform differences; it is not a precise topographic survey.
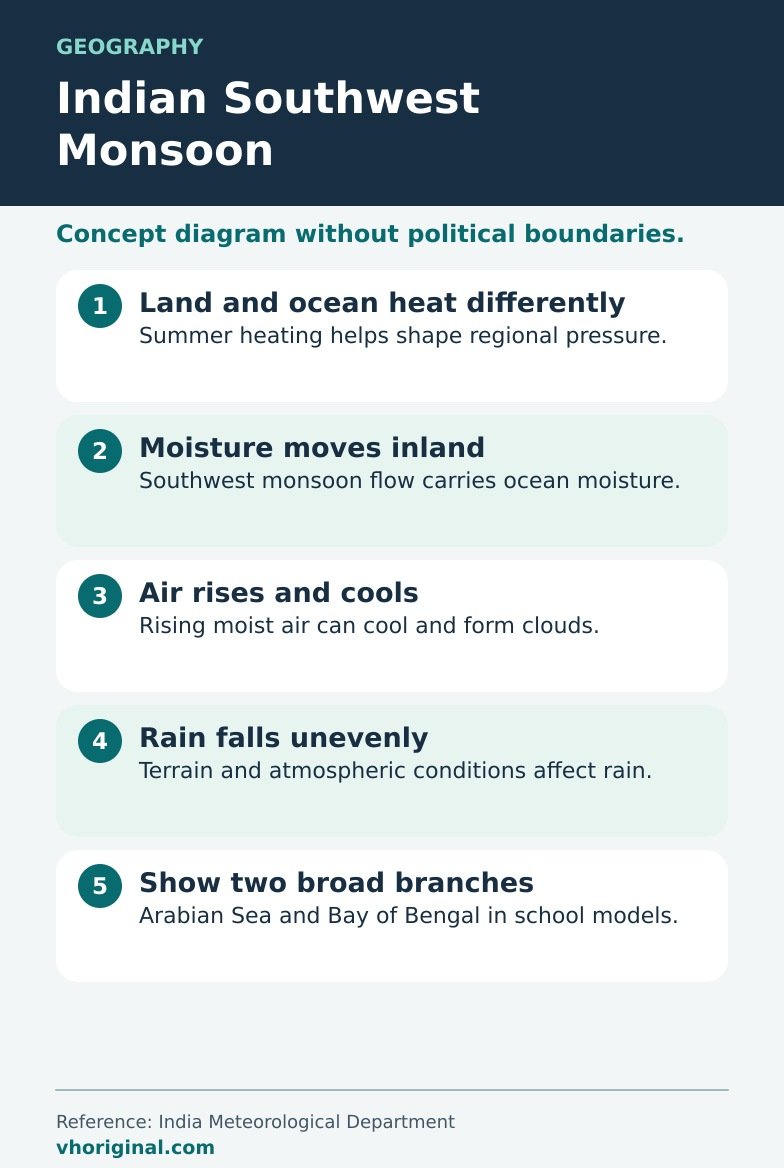
Picture 3: Indian Southwest Monsoon Formation
The Indian summer monsoon is shaped by several connected processes, including seasonal land–sea temperature contrasts, pressure patterns, the northward movement of the Intertropical Convergence Zone and large-scale atmospheric circulation. Moisture-bearing air moves across the Indian Ocean and contributes to the southwest monsoon flow. Winds crossing the Equator are deflected partly because of Earth’s rotation. The Arabian Sea and Bay of Bengal are important moisture pathways. An illustrated monsoon arrow is a broad explanation, not a forecast for rainfall at a specific village. Do not reduce the entire mechanism to one daily sea-breeze cycle.
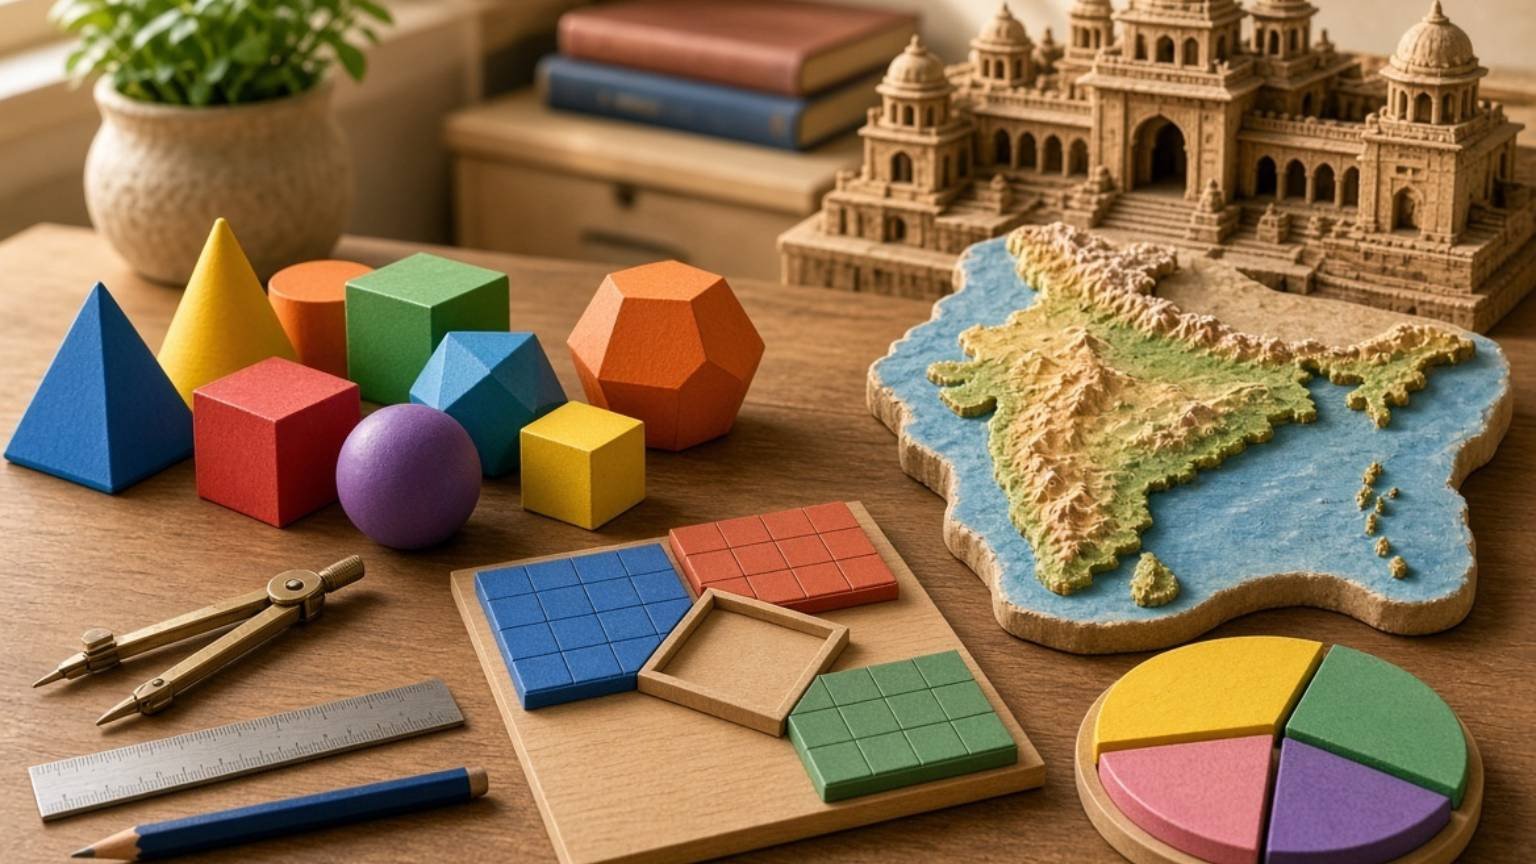
Materials for an A4 chart or 3D relief model
Use A4 paper, pencil, eraser, ruler, colouring tools, clean cardboard and paper strips. Draw the outline lightly before strengthening its border. For the relief model, stack coloured paper at several heights rather than requiring clay or plaster. Use blue paper arrows to represent broad moist wind movement on the monsoon chart, and a separate rainfall symbol. Give each picture a title and leave room for a legend. If a teacher wants a hand-drawn map, use the full-size poster as a reference rather than printing it as the entire assignment.
Step-by-step: make the India geography display
First identify what the teacher has assigned: an outline, a physical map or monsoon formation. Open the corresponding full-size image and note key elements. Sketch India’s shape and carefully correct proportions before colouring. Label mountain belts, plains, desert and plateau only when appropriate to the assignment. For a monsoon diagram, draw directional arrows and distinguish them from topographical labels. Add a north arrow and concise legend. Verify states and political boundaries using official material rather than an AI poster. Finish by asking the student to name one physical region and explain one atmospheric influence on rainfall.
Class presentation and simple viva answers
A teacher might ask how an outline differs from a relief map: the first locates places while the second represents landforms and elevation. Does India receive equal rainfall everywhere? No; terrain and atmospheric conditions influence distribution. Is the ITCZ the only control on the monsoon? No. Different factors interact over time and space. Students should explain a few labels and arrows in their own words, not memorise a page of unrelated facts. For an exhibition, a clean map with a correct legend often communicates more than a crowded display with several unreadable place names.
Common mistakes, map accuracy and image downloads
Watch for distorted boundaries, misspelt state names and incorrect landform locations. Do not copy an outdated administrative map without checking it. Monsoon arrows should represent broad circulation rather than a promise of rain in a specific month at every location. Open the full-size links below the pictures to view or save each diagram. Printed examples can help draw the chart, but teachers may require independent work. Correct scientific explanations and accepted cartographic information should take priority over colourful design. Include source names when the assignment expects references.
Frequently asked questions
Where can I check India’s official map?
Use current Survey of India material and an approved, up-to-date school atlas.
Which features belong on a relief map?
The Himalayas, Northern Plains, Peninsular Plateau, desert, coasts and islands are major regions.
Is the southwest monsoon merely a large sea breeze?
No. ITCZ movement, large-scale circulation, humidity and other factors matter.
How do I download these project pictures?
Open a full-size image link and use Save Image in your browser.
Conclusion and sources
These three pictures teach the difference between map reading, physical geography and atmospheric processes while reinforcing the need to verify maps and labels.
Related school resources: India Blank Map Guide · School Project Front Page
Sources: Survey of India; PIB — Indian Southwest Monsoon; NCERT.
Related project: rain gauge and wind vane models
Sources: Survey of India • Outline maps · Survey of India • Physical map





Share Your Opinion
Comments are closed on this post.