 Vista
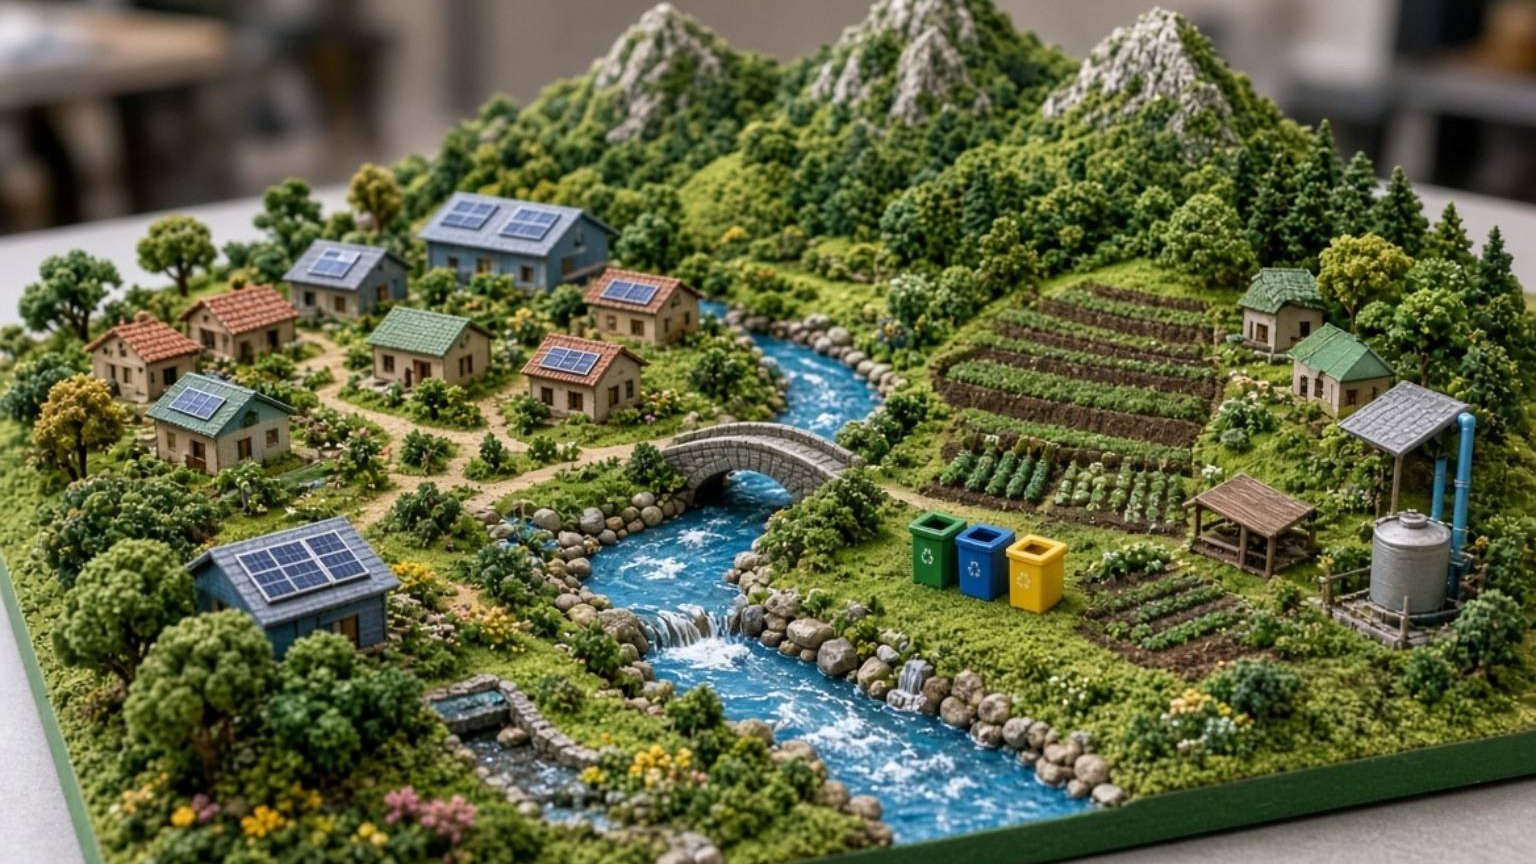
Need pollution school project charts with pictures? This visual guide combines four related topics: air pollution, water pollution, noise pollution, and microplastics in the food chain. Each topic has its own full-size educational poster, description and project-making suggestions for roughly Classes 4–10. You can examine the pictures before drawing an A4 chart or arranging a science exhibition board. The aim is to distinguish different pollution sources, understand realistic prevention measures and avoid unsupported claims. A strong project explains why something is a problem and what can be done—not merely a colourful poster labelled ‘Save Earth’.
What should a pollution school project explain?
Pollution involves substances or forms of energy introduced into an environment in ways that can cause harm. Smoke and fine particles can affect air quality; sewage and other contaminants can damage waterways; excessive or unwanted sound can disrupt daily life. Tiny plastic fragments raise additional environmental questions. These topics share an environmental theme, but they do not have identical causes or remedies. Give each poster a distinct heading. Ask students to identify a source, a possible consequence and a reasonable action. Avoid invented percentages or a frightening health claim unless a reliable study actually supports it. The surrounding words should explain the picture rather than merely repeat its title.
Picture 1: Air Pollution Sources Chart
An air pollution chart can show road traffic emissions, industrial sources, open waste burning and dust from construction. The existence of a factory or a vehicle in a picture does not demonstrate a measured pollution concentration. Some pollutants are visible as smoke or dust; others are gases or particles that cannot be identified just by looking. Useful preventive themes include avoiding open waste burning, controlling dust, using appropriate transport measures and following environmental standards. Create two small columns labelled Sources and Actions, with concise examples. Do not imply that every cloud of mist is toxic smoke or that every emission consists of a single chemical.

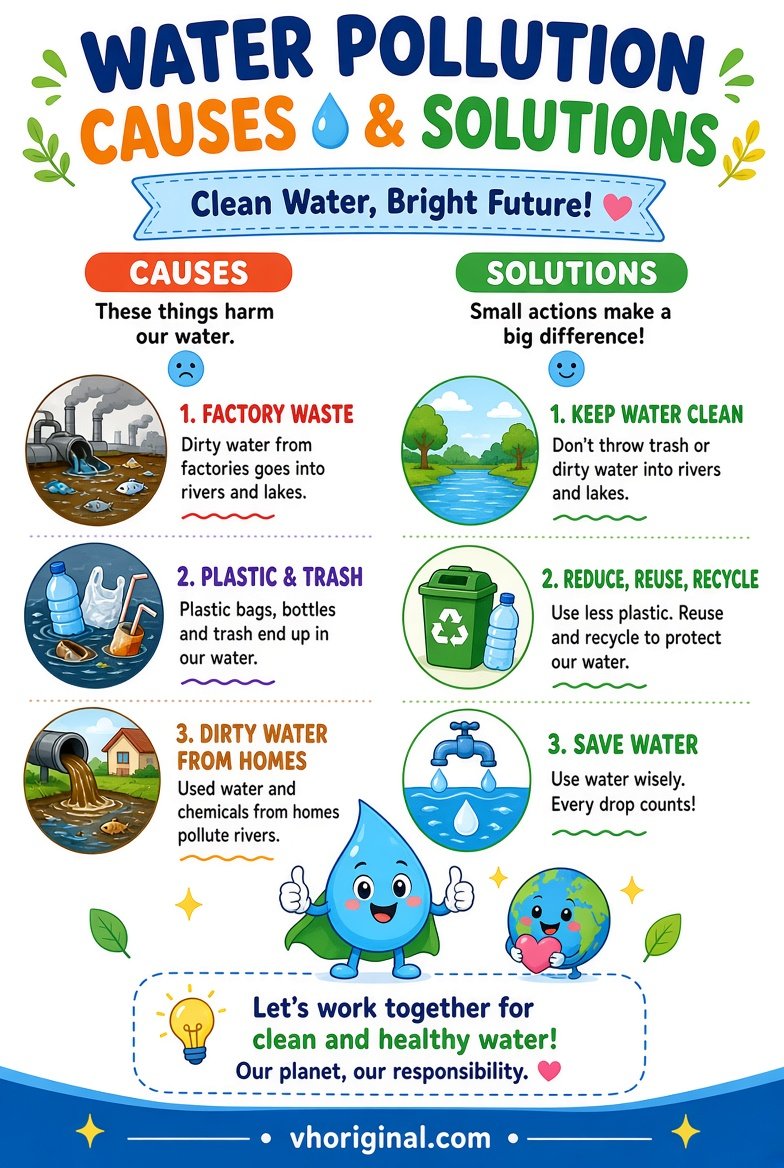
Picture 2: Water Pollution Causes and Solutions
Water pollution may come from untreated sewage, discarded waste, some industrial effluents and run-off carrying agricultural substances. A diagram of a dirty river can illustrate a pathway from source to water body. It cannot prove what chemicals or microorganisms are present. More importantly, clear-looking water is not necessarily safe to drink. Keep that distinction visible in the caption. For a school assignment, explain wastewater treatment, responsible waste disposal and protection of rivers and lakes. There is no need to collect sewage or touch contaminated pond water. Use clean water and paper models if you want a classroom demonstration.
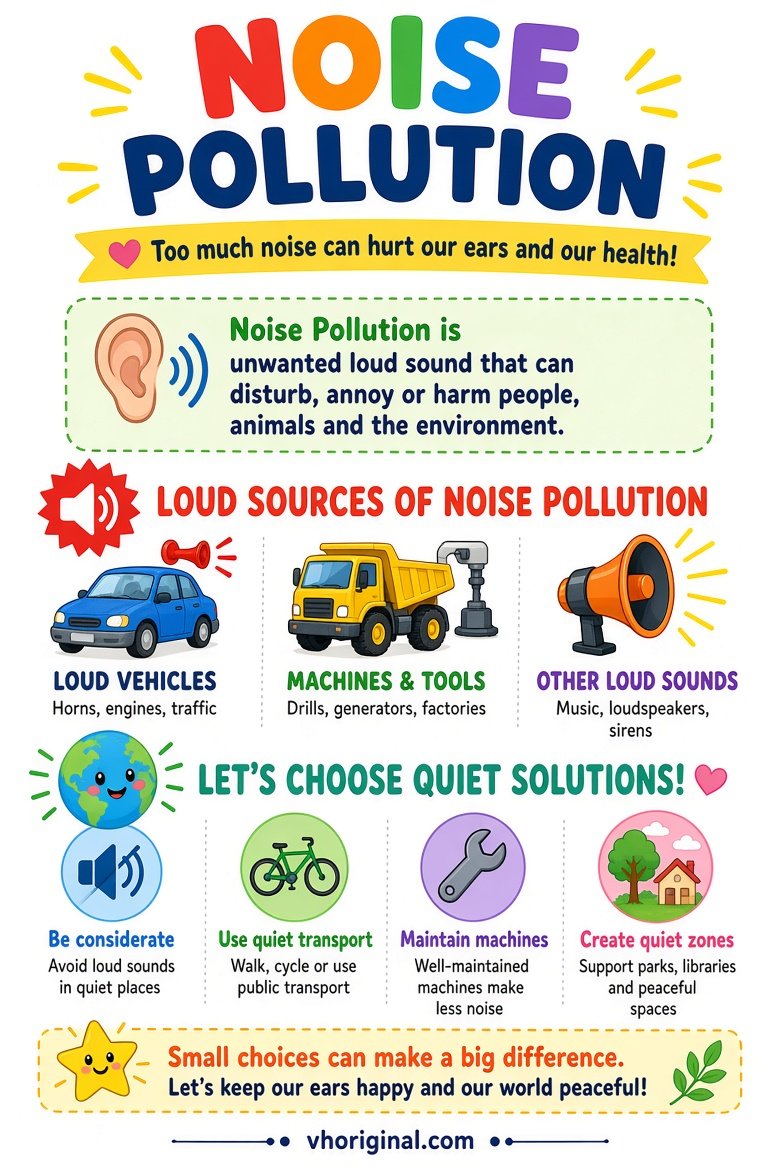
Picture 3: Noise Pollution Causes and Solutions
Noise becomes an environmental concern when sound is unwanted, excessive or disruptive in a particular setting. Traffic horns, loud amplified sound, machinery and building activities offer familiar examples. Context matters: sound level, duration, time of day and exposure influence the concern. Do not label a poster ‘120 decibels’ without an actual measurement. Students can explain quieter behaviour, reduced unnecessary honking, attention to local restrictions and greater distance from loud sources. The school model should not require children to produce very loud noises or place sound sources near anyone’s ears. A simple drawing is safer and more useful.
Picture 4: Microplastics in the Food Chain
Microplastics are small pieces or particles of plastic found in many environmental settings. Larger plastics can break down into smaller fragments; other sources can also contribute particles. Researchers study whether aquatic organisms take up such particles and what happens across food webs. The science has important uncertainties, including differences in exposure and possible effects. A conceptual food-chain infographic should not be presented as proof that every person has a particular dose or disease. Use arrows to explain a possible pathway, and distinguish scientific investigation from verified effects. Never grind plastic to produce particles for a classroom activity.

Materials for an A4 chart or exhibition board
Use paper, pencil, ruler, colour pencils and clean cardboard. Give each pollution type its own clearly labelled area. If four full posters cannot fit on one A4 page legibly, print separately. Use only safe illustrations, never sewage samples or burned waste.
Step-by-step: making four pollution charts
Begin with the class assignment and decide whether it expects one pollution type or a comparison. Open each full-size image and choose suitable examples. Sketch a clear title and main illustration in pencil. For air, identify visible sources; for water, show pathways into a lake or river; for noise, show common sources and safer behaviour; for microplastics, use a conceptual chain of possible exposure. Add arrows only when their meaning is clear. Colour the diagrams without obscuring small words, then write two or three explanatory sentences beside each. Finish by asking the student to explain one change that could help locally.
Presentation questions and mistakes to avoid
A useful school presentation can begin: ‘My project compares four types of pollution and ways to reduce them.’ A teacher may ask whether water is safe because it looks transparent; the answer is no. Another question is whether all pollution is visible; again, no. Sound is not automatically harmful just because someone can hear it. Avoid unverified numerical claims about air quality, noise exposure or microplastic intake. The child does not need to handle dirty water, burn waste or create high-volume sound to demonstrate any of these concepts. Safe observation, accurate diagrams and concise explanations are enough.
Frequently asked questions
Which pollution chart suits Class 5?
Air or water pollution charts with a few sources and practical prevention ideas are accessible choices.
Can I fit all four posters on one A4 sheet?
Only if the labels remain readable; otherwise use several pages or select examples.
Is the microplastics infographic proof of a health effect?
No. It is a conceptual school diagram; scientific exposure and effects require evidence.
Should students collect dirty water for this project?
No. Use illustrations or safe classroom materials instead.
Conclusion and references
Good environmental projects combine clear visuals with reliable explanations, uncertainty where appropriate, and specific safer actions students can understand.
Related school project: 8 Easy Science Working Models
Sources: Illinois EPA — Microplastics; CDC — Water Safety.
Related project: five senses chart

















Share Your Opinion
Comments are closed on this post.