 Vista

Looking for soil layers or river erosion school project diagrams? This page provides three connected Earth Science pictures: a labelled Soil Profile, River Erosion and Deposition around bends, and a Flood Prevention Village Model. These are useful for roughly Classes 5–10 because they introduce how land materials develop, how running water moves sediment and why safer floodplain planning matters. Each poster can be opened full-size and used to prepare an A4 chart or cardboard scene. The village illustration is only an educational model, not an engineering design or proof that a particular home will be safe from flooding. Use realistic explanations, clear arrows and safe materials throughout.
How are soils, rivers and floods connected?
Soils, landscapes and rivers influence one another. Rain and flowing water may remove particles from one place, transport them and deposit them elsewhere. Sediment movement changes landforms over time. Flooding can occur when water spreads across land that is not usually submerged, but its causes are more complicated than one blocked channel or one heavy shower. Rainfall, river conditions, drainage, land development and other factors can contribute. Keep the three classroom posters distinct: soil formation is not the same process as deposition at a meander, and flood risk cannot be explained by a single paper wall.
Picture 1: Soil Layers and Soil Horizons
A soil profile may show horizons with differences in organic matter, colour, minerals and texture. A surface layer may support plants and organisms, while deeper material can have different characteristics. Diagrams often label O, A, E, B and C horizons, but not every soil has all of them clearly developed. Parent material and underlying bedrock are often included for teaching purposes. Soil formation reflects climate, organisms, parent materials, topography and time. On an A4 chart, distinguish the layers with readable labels instead of assuming they are equally thick everywhere. There is no need to dig a dangerous deep hole.

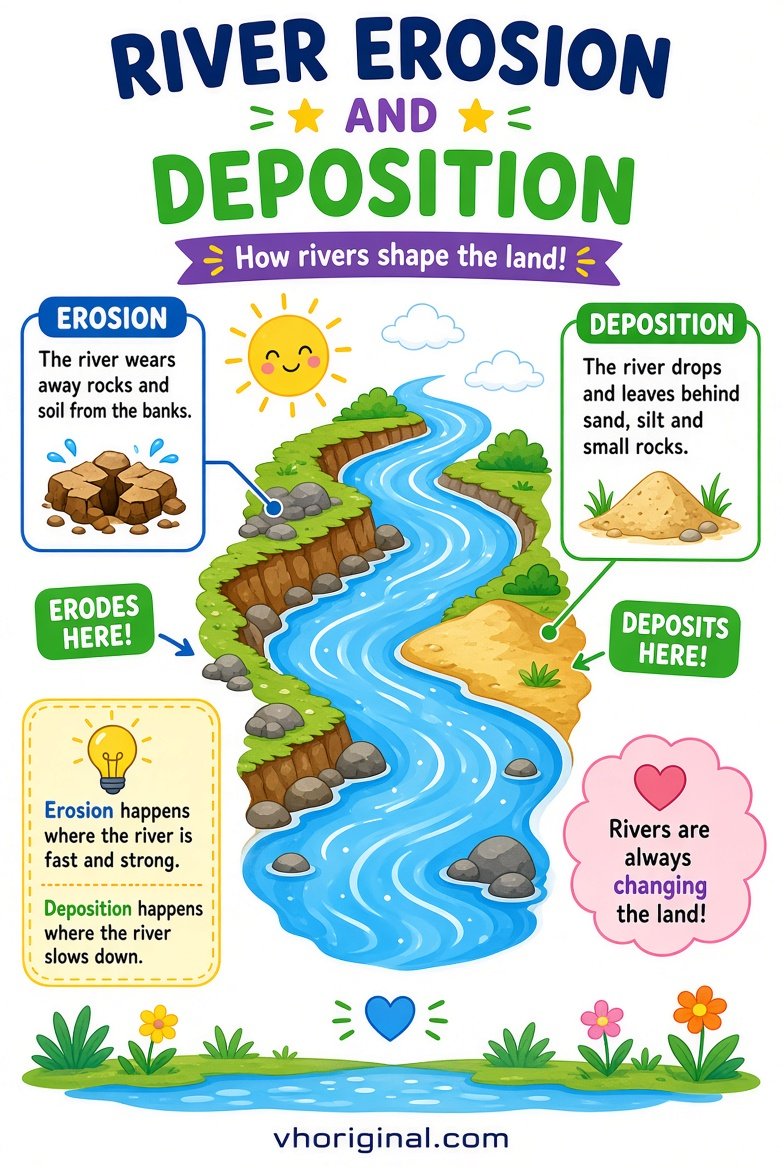
Picture 2: River Erosion and Deposition
A river can remove, carry and deposit sediment. In many meandering river reaches, flow tends to erode the outer bank and deposit material along the slower inner bend. The exact pattern depends on depth, velocity, sediment and the river’s changing geometry, so this is a useful generalisation rather than a rule for every bend. Label water flow, outer bank, inner bank and deposited sediment. Use arrows that show where water moves, not arrows that misleadingly indicate that an entire landscape shifts at once. A school poster teaches a process; it does not predict the future of one particular river.
Picture 3: Flood Prevention Village Model
A village diorama can illustrate safer land-use planning, drainage routes, buildings on appropriate higher ground and the importance of warning and evacuation. Levees, drainage channels and protective structures may have roles in some places, but none provides universal protection from every flood. In real life, flood-risk decisions require local maps, hydrology, engineering and official warnings. A model should label possible floodwater pathways and safer routes while acknowledging those limitations. Do not tell students to build barriers across real drainage channels based on the cardboard arrangement. Paper buildings and landscape colours are enough to teach the principle.
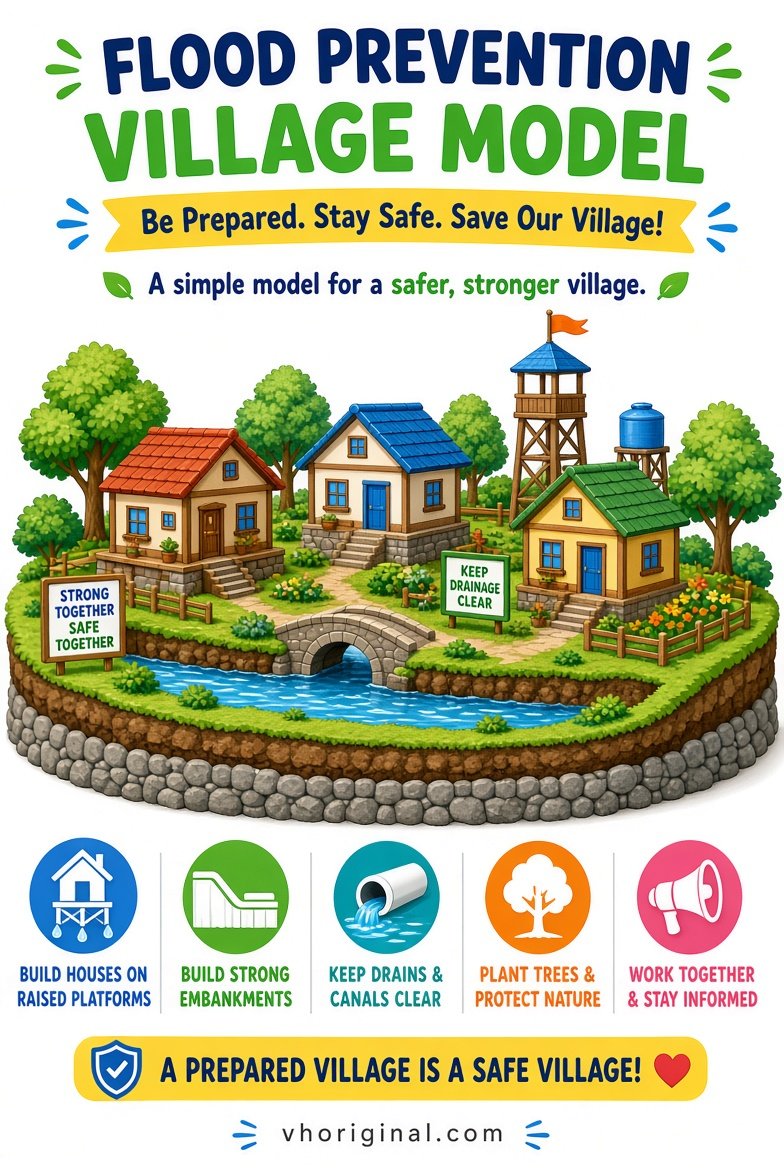
Chart note: This model illustrates ways to reduce flood risk. Site-specific flood protection, buildings and embankments require qualified assessment and local approval.
Materials for a safe A4 chart or cardboard model
Use an A4 sheet, cardboard base, pencils, rulers, markers, coloured paper and safe glue. Make the soil layers with horizontal paper bands rather than excavated samples. Create a winding river using a blue paper strip, then label an inner and outer bend. For the village model, fold paper houses and mark possible routes for water. There is no need to handle contaminated river mud or wastewater. If the teacher requests flowing water, use a small tray with clean water under adult supervision, and keep the setup away from electricity and slippery floors. Larger and simpler labels make the model easier to understand.
Step-by-step: making the three geography models
First confirm whether the assignment requires soil, river erosion or flood safety. Open the corresponding full-size reference image. Sketch a title and the major shapes before colouring. For soil, lay out the horizons from top to bottom and label them carefully. For erosion, draw a meandering channel and distinguish where sediment may be removed or deposited. For the village, mark higher and lower ground and show possible drainage paths. Add a short box explaining what the model does and does not prove. Check each arrow and term against the textbook. Separate sheets are better than three unreadable thumbnails.
School presentation and viva questions
Students can begin: ‘My pictures compare soil layers, river changes and flood risk.’ A teacher may ask whether every soil has identical horizons; the answer is no. What is the difference between erosion and deposition? One removes and transports material; the other involves material settling. Does a paper embankment guarantee a flood-free village? No. Real flood safety depends on local conditions and official planning. This approach teaches uncertainty and risk without pretending the classroom has solved an engineering problem. Two or three well-explained examples are enough for a strong oral presentation.
Safety, common mistakes and image downloads
Never go to a flooded riverbank or fast-flowing channel to collect project materials. Do not enter deep holes, drains or unstable slopes. Check whether a digitally illustrated soil profile labels its layers realistically and whether the river arrows make sense. If a school requires hand-drawn charts, use the full-size pictures only as references. Open each poster through its image link and use your browser’s Save Image option. Avoid unsupported claims that one flood barrier will always work or that all soils contain exactly the same sequence of layers.
Frequently asked questions
Do all soil profiles contain identical layers?
No. Soil horizons vary with environment, parent material and soil-forming processes.
What is the difference between erosion and deposition?
Erosion removes material; deposition occurs where transported sediment settles.
Does a flood model guarantee protection?
No. It is an educational illustration rather than a certified engineering design.
How do I save the school project images?
Open each full-size picture link and choose Save Image in your browser.
Conclusion and references
Together these three diagrams explain soil profiles, sediment movement and the limits of flood-risk models, while keeping students away from unsafe field activities.
Related school projects: Science Working Models · Tree Drawing for School
References: USDA NRCS — Soil Facts; USGS — Erosion and Sediment.
Related project: rooftop rainwater harvesting model

















Share Your Opinion
Comments are closed on this post.