 Vista

Need carbon cycle, nitrogen cycle and greenhouse effect diagrams for a school project? This guide presents three separate educational posters suitable for approximately Classes 7–12. The carbon cycle tracks carbon moving through environmental reservoirs. The nitrogen cycle describes transformations that involve microbes, plants and other organisms. The greenhouse effect concerns the transfer of energy between Earth and its atmosphere. These subjects connect, but they are not interchangeable. Every diagram can be opened in full size and used as a drawing reference. Below are labelled explanations, easy paper-model materials, presentation tips and questions to help students avoid common scientific mistakes.
How are these three topics different?
Carbon and nitrogen are elements that cycle among the atmosphere, organisms, soil and other reservoirs. The greenhouse effect concerns radiation and energy rather than the cycling of material itself. Carbon dioxide is a greenhouse gas. Abundant atmospheric nitrogen gas does not have the same heat-trapping properties, although nitrous oxide, another nitrogen compound, is a greenhouse gas. Keep the topics separate on a school display so that a visitor can recognise what each arrow means. Do not assume that a visually similar arrow in a carbon diagram must represent the same process in a nitrogen diagram.
Diagram 1: Carbon Cycle Labelled Chart
Plants take carbon dioxide from the atmosphere during photosynthesis and incorporate carbon into organic molecules. Animals obtain carbon through food. Respiration, decomposition and various combustion processes can release carbon dioxide. Oceans, soils, forests and rocks also store carbon, sometimes over very different periods. Label the atmosphere, plants, animals, soil and ocean clearly. The direction of each arrow depends on the specific process. Some pathways are very slow, so there is no single timeline for the whole cycle. Students need not burn any real fuel to explain fossil-fuel combustion; a labelled picture is sufficient.
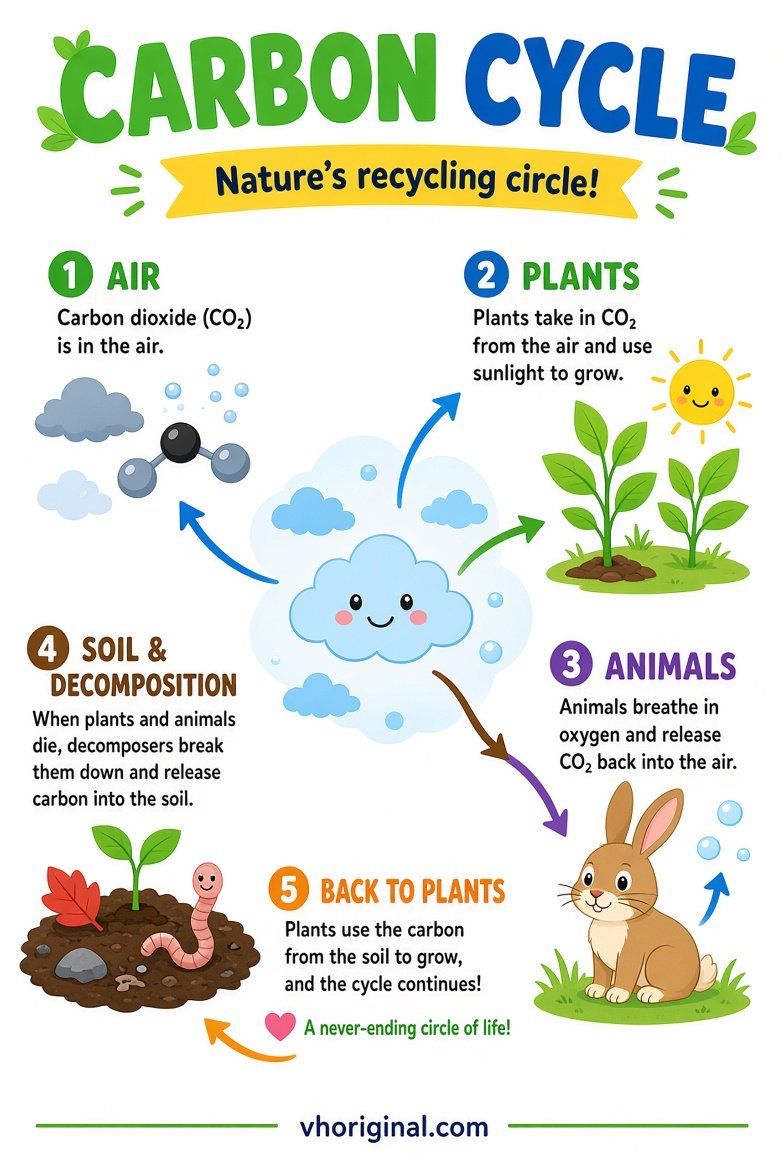
Chart note: The last arrow simplifies the cycle. For photosynthesis, land plants get most of their carbon from CO₂ in the air, while roots take up water and mineral nutrients.
Diagram 2: Nitrogen Cycle Stages
The atmosphere contains large amounts of N₂, but most plants cannot directly use nitrogen gas in that form. Certain microbes carry out nitrogen fixation, converting nitrogen into forms that enter biological pathways. Nitrification can convert ammonium to nitrite and nitrate. Plants assimilate usable forms, and animals obtain nitrogen through food. Decomposition returns nitrogen compounds to the environment; denitrification can release nitrogen to the atmosphere. A classroom poster should distinguish these terms and show where soil microorganisms participate. Avoid labelling all nitrogen compounds as plain N₂ or implying that every microbe performs every step.
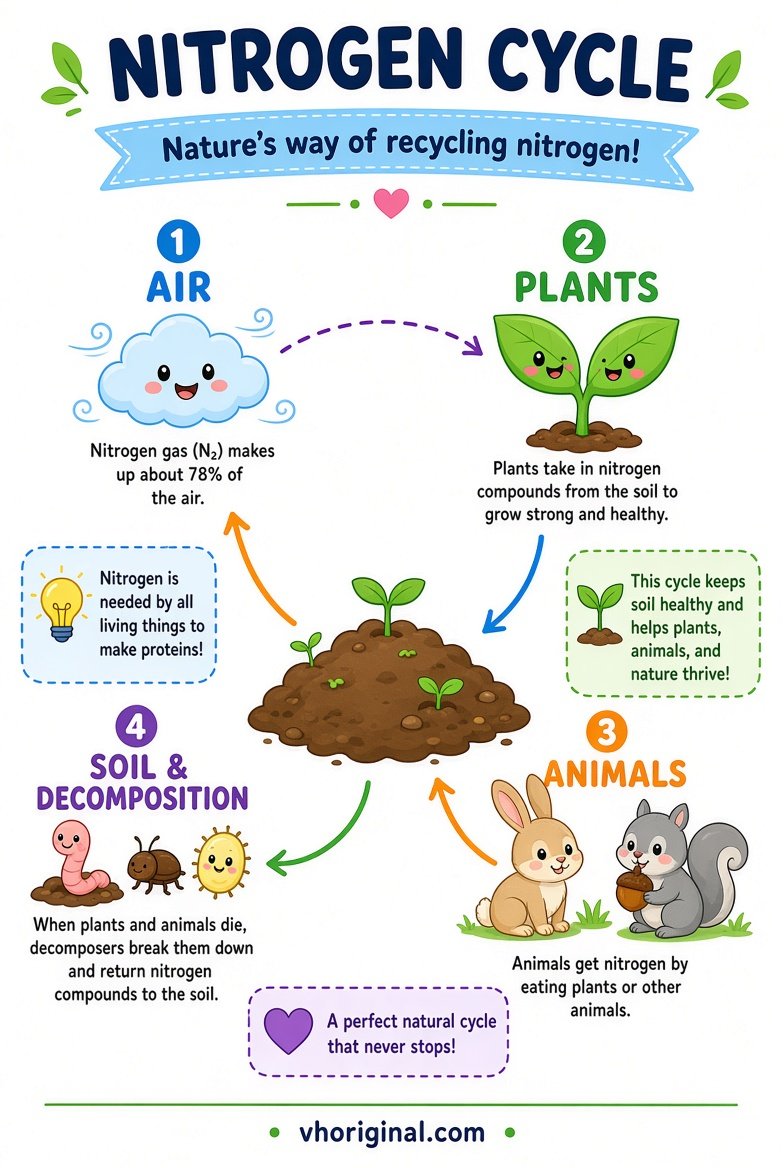
Chart note: The dashed arrow skips nitrogen fixation. Microbes make atmospheric nitrogen available, and most plants take up nitrate or ammonium from the soil.
Diagram 3: Greenhouse Effect School Model
Sunlight warms Earth’s surface, which emits infrared radiation. Greenhouse gases absorb and re-emit some infrared radiation, affecting the planet’s energy balance. The natural greenhouse effect is important for habitable conditions, while increased greenhouse gas concentrations can contribute to further warming. A transparent box warmed by a lamp is only a partial analogy, not an exact physical model of atmospheric radiation. If a poster uses a box experiment, explain those limitations rather than claiming that the temperature difference proves a particular future climate change value. Separate incoming solar radiation from outgoing infrared radiation in the drawing.

Chart note: Greenhouse gases absorb some outgoing infrared radiation and re-emit it in all directions. The red outline represents a process, not a physical barrier.
Choosing the right detail for Classes 7–12
Younger students can identify air, soil, plants and simple arrows. Middle grades can explain photosynthesis, respiration, nitrogen fixation and greenhouse gases. Older students can add the role of carbon reservoirs, multiple microbial pathways and Earth’s radiation balance. Do not add complex formulas that neither the child nor the teacher can read. A complete cycle does not mean every carbon or nitrogen atom follows exactly one route or returns instantly. Classroom illustrations simplify larger environmental systems; the main goal is a correct explanation rather than an impressive number of labels.
Materials for an A4 school science chart
Use chart paper, pencil, ruler, eraser, markers, colour pencils and optionally clean cardboard. Printed references are useful if school instructions allow them. Make the carbon reservoirs distinct in the first diagram. In the nitrogen cycle, give bacteria and plant roots their own labels. For the greenhouse effect, separate incoming sunlight and outgoing infrared energy using different colours. Paper models are safer than improvised gas experiments, open flames or powerful lamps. If all three charts share one display board, provide enough space for each topic instead of shrinking the lettering until it becomes unreadable.
Step-by-step: make and check the diagrams
Start by reading the assigned topic and selecting the relevant full-size poster. Write a list of essential reservoirs or processes. Sketch their positions lightly before adding arrows. Give every arrow a real meaning and check whether its direction matches the science. Do not reuse the carbon-cycle arrows automatically for the nitrogen-cycle chart. In a greenhouse illustration, avoid drawing heat as if it were trapped behind a perfect solid wall. Colour and label the diagram, then verify scientific terms against a textbook. Finally ask the pupil to explain three connections without reading the entire poster aloud.
Presentation, common mistakes and image download
A teacher might ask where plants obtain carbon, how microbes contribute to nitrogen transformations or whether the greenhouse effect is inherently harmful. Explain that plants use atmospheric CO₂, microbes influence nitrogen forms and the natural greenhouse effect supports Earth’s energy balance. Do not confuse the ozone hole with greenhouse warming. Do not assume most plants use N₂ gas directly. Open the full-size link below each diagram and use your browser’s Save Image option. Labels in generated images can be mistaken, so verify chemical terms and arrow directions before printing or redrawing.
Frequently asked questions
What do plants do in the carbon cycle?
They use atmospheric carbon dioxide during photosynthesis to build organic material.
Can most plants use N₂ gas directly?
No; nitrogen must generally be converted into accessible chemical forms.
Is the greenhouse effect always bad?
No. The natural effect is important; additional greenhouse warming is the concern.
Can all three diagrams fit on one A4 page?
Use separate sheets if arrows or labels become too small to read.
Conclusion and sources
Together, these diagrams teach how matter moves through environmental cycles and how greenhouse gases influence Earth’s energy balance.
Related projects: Science Working Models · Easy Tree Drawing
Sources: NASA Carbon Cycle; NOAA Greenhouse Effect.
Related project: air water and noise pollution charts



















Share Your Opinion
Comments are closed on this post.