 Vista
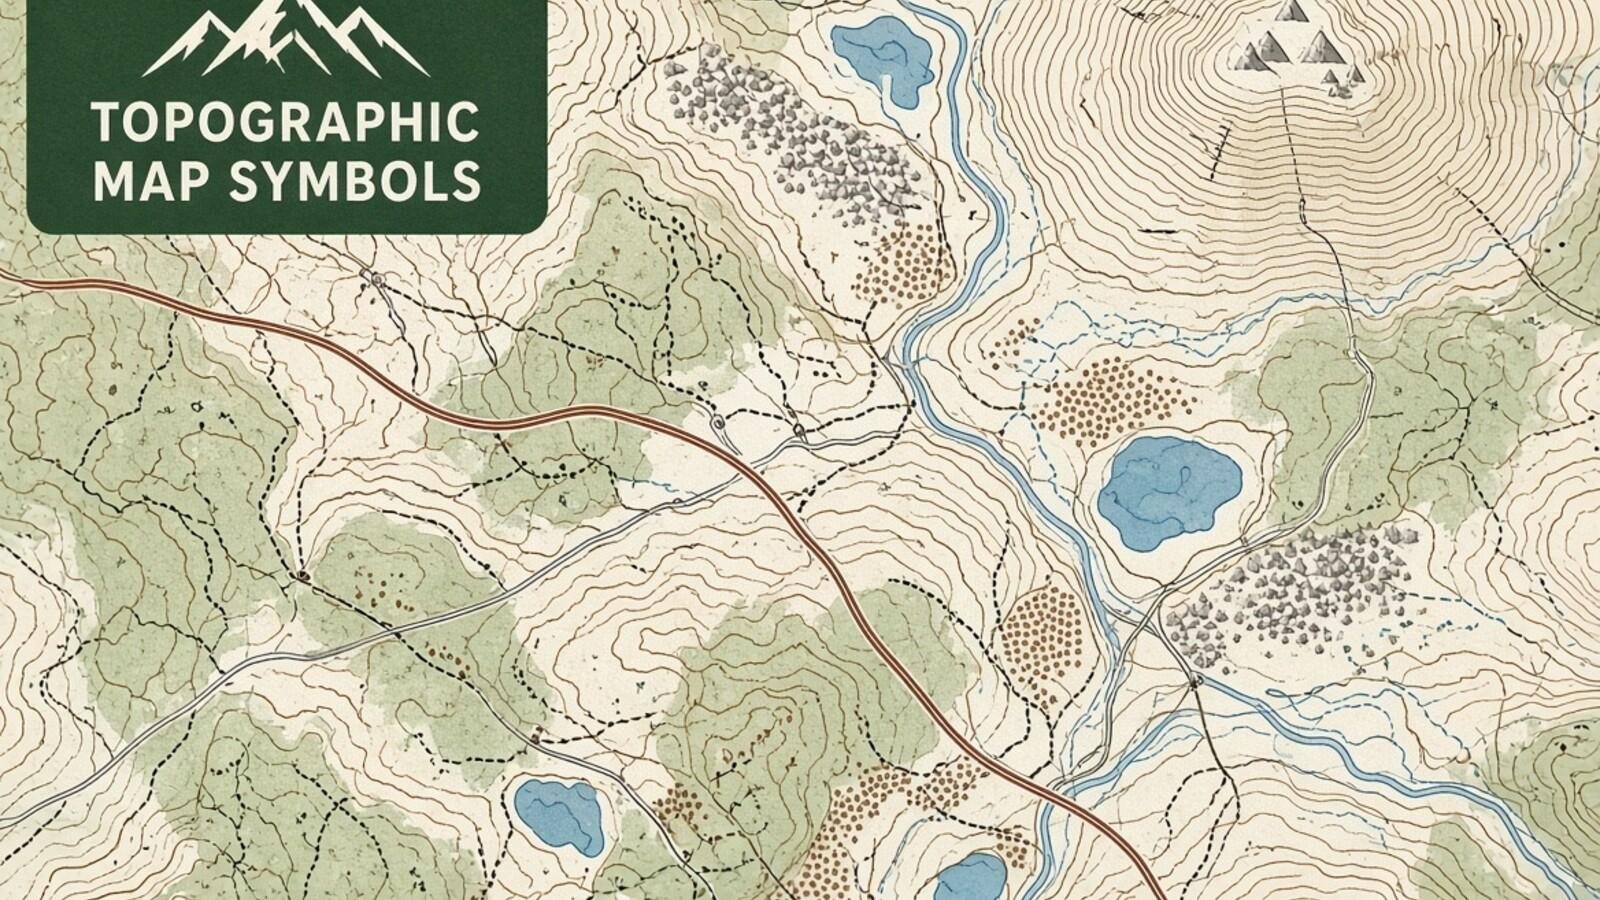
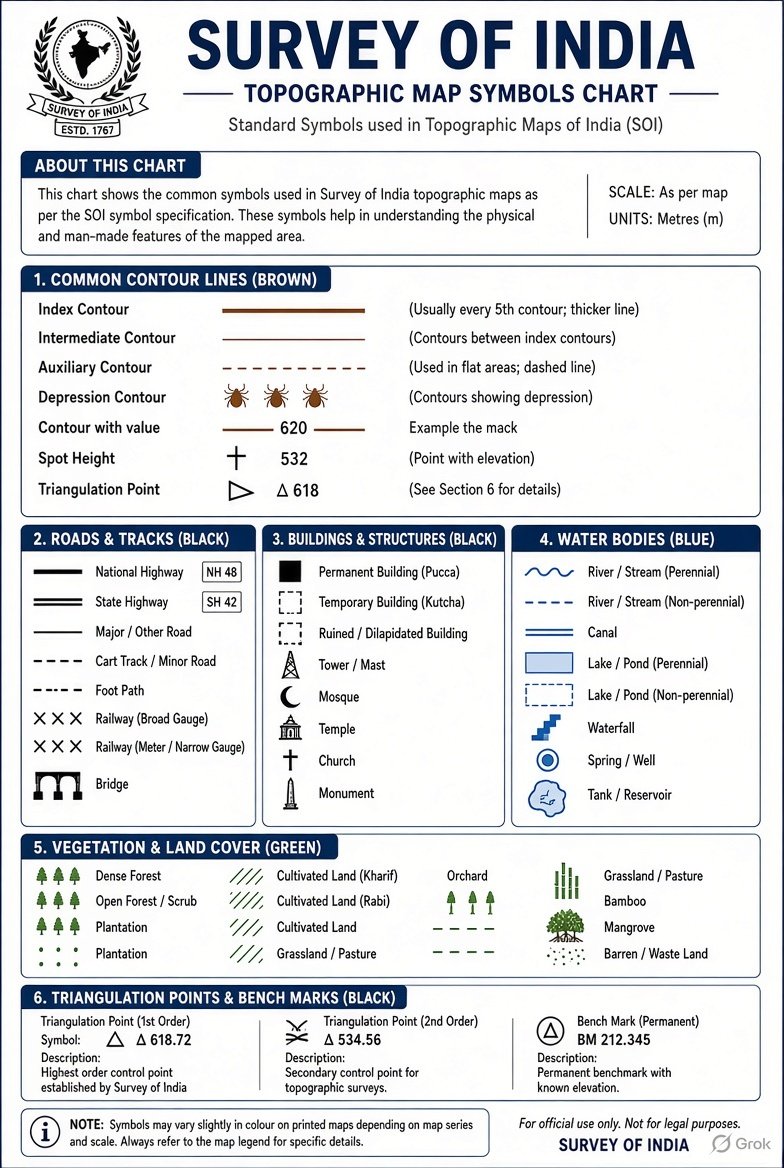
Quick answer: A Survey of India topographic map uses conventional signs to represent roads, rivers, forests, buildings, contour heights and many other features that cannot be shown to their true physical size at map scale. The official Survey of India metric-system conventional-signs chart gives numbered illustrations for a broad range of features. A simple study poster is an introduction, not a replacement for a toposheet’s own legend or the official sheet.
Updated: 21 November 2026.
What are Survey of India conventional map symbols?
Conventional signs are agreed graphic marks used by mapmakers to show natural and human-made features on a topographic map. They include lines, dots, patterns, symbols, abbreviations and colour washes. A school student may be able to recognise a river, cart track or temple from the legend even when the map represents a very large territory in a small space. Such symbols help readers interpret terrain and settlements consistently.
Survey of India publishes a metric-system chart of conventional signs with numbered descriptions and illustrations. Its second edition, published in 1990, includes a wide selection of features ranging from buildings, aerodromes and water features to roads, forests, landforms and coastal objects. This is a historical but official reference; it does not imply that every modern online map uses the identical graphic style. New mapping products can have their own legends, scales and digital conventions. Always check the exact map you are reading.
Map symbols for rivers, streams, canals and wells
Blue colouring is commonly associated with water features on many topographical maps, but the exact symbol can distinguish a perennial river, seasonal stream, canal, well, tank, waterfall, dam or other water structure. Symbols may change depending on whether the watercourse is narrow enough to be represented as a single line at the printed scale or wide enough to show its banks. A reader should inspect the line pattern as well as the colour.
Do not infer drinkable water or year-round water availability from the mere presence of a blue mark. Some water features are intermittent, and a map may reflect survey conditions at its date of production. A well or tank shown on an old sheet may have changed or disappeared. For school geography, identify the named type using the official chart and map legend. For field travel, verify present conditions with suitable current information rather than navigating to a water source based only on a historic conventional sign.
Roads, cart tracks, railways and bridge symbols
A topographic sheet may distinguish metalled roads, unmetalled roads, cart tracks, footpaths, railways, bridges and crossings through different line conventions. The line thickness, dash pattern or supplementary symbol can indicate a route’s category. Scale matters because a very narrow feature cannot be shown with exact real-world width; symbols must stay visible after reduction. The Survey of India chart includes multiple categories for roads and rail-related structures.
A double line in a particular legend does not automatically prove that a present-day highway has two lanes. Likewise, an old cart track may now be paved, and a road drawn as a continuous line may have access restrictions in real life. For a classroom project, first identify the symbol and read its map key, then relate it to the topography and nearby settlement. For practical route decisions, current authoritative road information and local conditions are required. Do not use an archived map as a substitute for live navigation.
Settlements, temples, schools and public features
Maps use point symbols and building outlines to identify settlements, isolated houses, monuments, places of worship and certain institutions. Some appear with their own abbreviations or labels rather than an easily remembered universal picture. The official conventional-sign chart includes symbols for villages, buildings and other human features with several lettered variants. Recognition depends on the chart edition, intended map scale and the context printed next to the symbol.
A small map symbol is not proof of a building’s present opening hours, ownership or exact use. A temple marked on an older Survey of India sheet might have been renamed or the surrounding settlement expanded. A black dot may have different meanings in different symbol families. The safe way to interpret it is to compare the map’s legend, labels, neighbouring linework and scale. Avoid inventing an icon from a modern digital mapping app and claiming that it is an official Survey of India conventional sign.
Contours, hill slopes and the contour interval
A contour is a line joining locations of equal elevation, typically shown using a consistent vertical datum. Closely spaced contours generally indicate steeper slopes, while widely spaced ones suggest gentler terrain where the surface changes more slowly. A hill may be represented by closed contour shapes and height annotations. The contour interval is the vertical height difference between adjacent contour levels on a given map. It must be read from the sheet’s margin rather than assumed to be the same everywhere.
For example, if neighbouring contours on one sheet are labelled 200 m and 220 m and the stated contour interval is 20 m, their vertical difference is twenty metres. The horizontal distance between them determines approximate steepness, and this distance must be interpreted with the map scale. An infographic that places random rings around a hill without consistent contour heights can be misleading. On an actual toposheet, check contour values, spot heights, cliff symbols and drainage patterns together before drawing conclusions about terrain.
Bench mark, triangulation station and spot height
Spot heights give elevation values for specific points marked on a map. Benchmarks identify surveyed reference points with height information, while triangulation stations are associated with geodetic survey control and may have their own symbols and identifiers. They are not interchangeable merely because all can appear near a number. The Survey of India conventional-signs chart includes different representations for height and survey-control information.
A student comparing a bench mark with a spot height should inspect the actual marker, its abbreviation and the surrounding label. In field conditions, a printed point may not correspond to a clearly visible monument or a place accessible to visitors. Horizontal position, datum and elevation source matter for professional surveying; a simple reading chart does not provide survey-grade precision. For civil works or land records, do not use an unverified screenshot as authoritative coordinates or a property-boundary determination. Consult the relevant official survey dataset and a qualified survey professional.
Forests, cultivated land, boundaries and map colours
Green often indicates vegetation or forest-related features in conventional coloured toposheets, while certain land-use categories, boundaries and settlements use different patterns and tints. The exact symbolism depends on the Survey of India chart and the particular sheet. The 1990 chart notes that some colour wash conventions differ at different scales, including omissions of yellow washes on some 1:250,000 maps. Therefore ‘every green area means protected forest’ would be an unsafe oversimplification.
A boundary line can represent an administrative or mapped division rather than a physical fence. Dashed marks, small repetitive strokes or colour bands can have different legal and cartographic meanings. A school diagram should distinguish forest ownership categories, cultivated areas and boundaries using a verified legend. Do not infer current land rights, environmental clearance or official administrative boundaries from an old illustration. When a location’s current official status matters, consult the appropriate government agency’s up-to-date maps and records.
Reading a 1:50,000 toposheet and avoiding chart errors
A map scale of 1:50,000 means one centimetre on the printed map corresponds to 50,000 centimetres or 500 metres on the ground, assuming the map is reproduced at its intended size. The margins commonly provide sheet number, scale, contour interval and relevant legend details. If the map image has been resized on a phone, using a ruler against the screen without accounting for image scale is unreliable. A bar scale can be more robust when reproduced proportionally.
Start with the map title and revision, locate north, read the scale and grid information, then use the conventional-sign legend. Identify major water features and routes before studying contours, settlements and special symbols. Compare the downloadable Survey of India official chart for doubtful signs and remember that the old metric sign sheet includes scale-specific variants. For an educational infographic, depict common categories faithfully but do not label a simplified original drawing as a scanned certified official chart. Government maps and printed conventional-sign sheets also have applicable reuse rules; link to the official source rather than making unsupported licensing claims.
Frequently asked questions
What are conventional signs on a toposheet?
Standardized graphical representations of natural and human-made geographic features.
What do closely spaced contours mean?
They usually indicate a steeper slope, other things being equal.
What is a benchmark on a topographic map?
A surveyed height-reference point, represented by the applicable map symbol and annotation.
Does 1:50,000 mean 1 cm equals 500 m?
Yes on the correctly scaled printed map: 1 cm represents 500 m on the ground.
Are Survey of India signs exactly the same as Google Maps icons?
No. Different cartographic products use their own legends and representation conventions.
Conclusion
Survey of India conventional signs give a solid framework for learning topographic maps. Always check the specific sheet’s scale, legend, contour interval, date and purpose before interpreting a feature.
Sources
- Survey of India — Official Conventional Signs Chart (1990)
- Survey of India — Miscellaneous Maps and Official Downloads
- IIT Kanpur SATHEE — NCERT Topographical Maps
Educational illustration only, not an official cadastral, legal-boundary or current navigation product.






















Share Your Opinion
Comments are closed on this post.