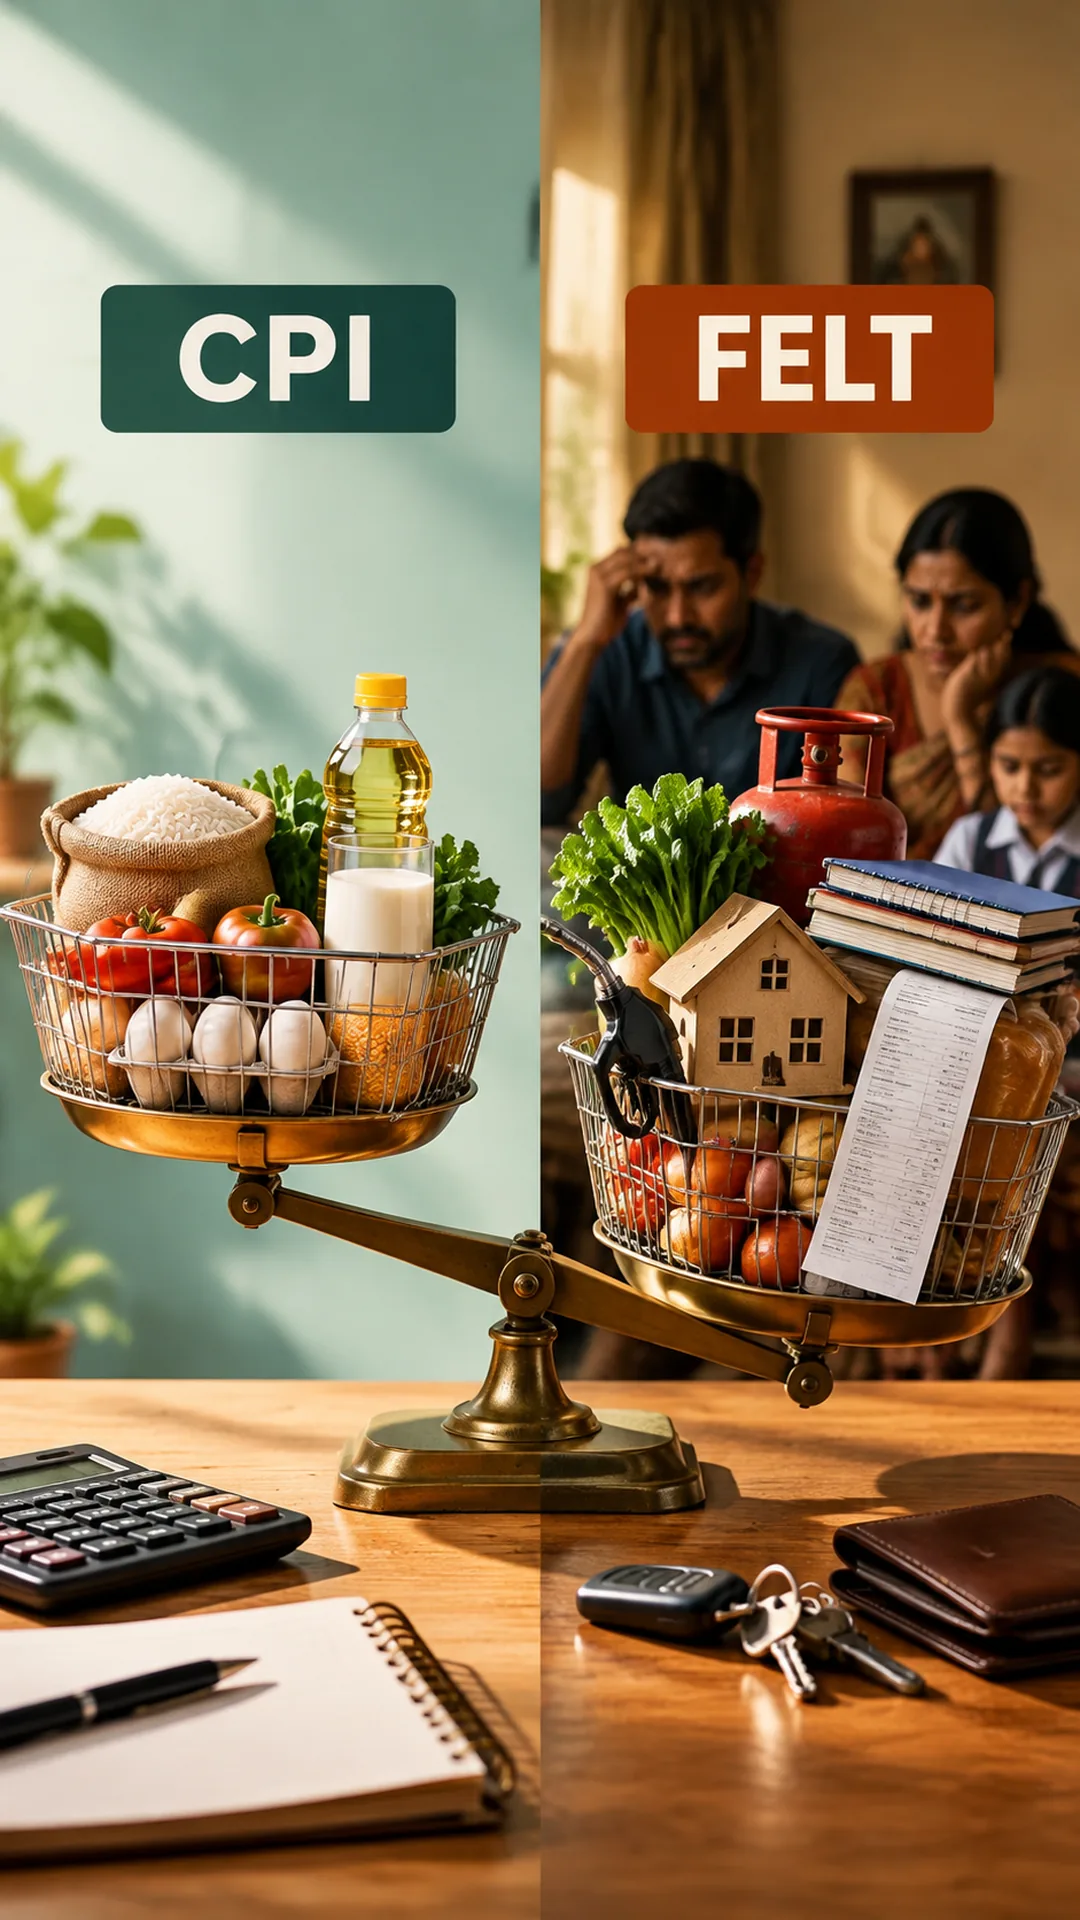
Newspapers report that inflation has softened, the numbers on TV look smaller, yet the grocery slip feels just as heavy. Rent remains stuck on renewal, school fees deliver a once-a-year shock, and vegetable prices change week by week. This conflict is not a lie; it is a matter of two different measuring scales. One scale is the average basket of an average household; the other is your daily wallet. In this article, we unwrap this distinction: the CPI inflation rate, the CPI index (price level), and felt household inflation — three concepts driven by similar words, but carrying very different meanings.
MoSPI’s official CPI framework shows what basket the country’s average consumer spends on, how the price of that basket is collected, and how the year-on-year percentage change is calculated. The household experience often diverges from this basket because frequently visible items stick in memory, annual expenses sit quietly, and in lower-income households, food accounts for a larger share of the budget. Below is a clear explanation based on verified framework details. If you wonder, “Why isn’t inflation falling?”, you first need to check whether you are talking about the rate, the price level, or your own household basket.
CPI Rate, CPI Index, and Household Felt Inflation — Three Different Questions
First, let’s clarify the terminology. The CPI index represents a price level. It indicates where the price of a set basket stands relative to the base period. If the index is high, goods are more expensive than before — a point that precedes any discussion of the rate. The CPI inflation rate is the year-on-year percentage change in that index. A falling rate simply means prices are not rising as fast as before. A falling rate does not mean prices have dropped, nor does it mean your shopping bill has become lighter.
Felt household inflation is a third concept. It is shaped by the items you buy frequently, bills that catch your eye, and items that form a major part of your monthly spend. The official figure looks at the average basket of an average household. But your household is not average. One family relies heavily on vegetables, milk, and oil; another on rent and school fees; another on fuel and transport. Even if the average rate softens, your specific combination may remain strained. The reverse can also happen: food may feel cheaper for some households while services feel expensive.
This is where confusion arises. Headlines stating “Inflation has fallen” usually refer to the inflation rate. But ears hear “Things have become cheaper.” These two statements are not the same. The index can remain high while the rate comes down, and your personal basket can move in a different direction altogether. Blending all three into a single sentence makes frustration understandable, but understanding incomplete.
What MoSPI’s CPI Measures — and What It Doesn’t
In India, MoSPI releases the Consumer Price Index across rural, urban, and combined series. The modern framework rests on recent survey data of habitual expenditure: the Household Consumption Expenditure Survey (HCES) 2023–24 shapes the basket weights, with calendar year 2024 serving as the price reference period. Items are classified across twelve divisions under COICOP-2018. Around 358 weighted items — spanning both goods and services — are tracked. Prices are gathered from a wide national sample: rural markets, urban markets, and selected online portals in major cities to ensure e-commerce purchases are included.
Weights are derived from the proportion of expenditure an average household allocated to each item in the survey. While the food share remains substantial, updated weights give greater space to housing, transport, healthcare, and services to reflect changing consumption patterns. Rural housing finds representation in modern frameworks. Employer-provided free or off-market housing is excluded to prevent market distortions. Free social transfers — where household expenditure is zero — do not enter the CPI basket. Certain state-regulated tariffs draw from administrative data, while selected services utilize online pricing sources.
This structure is an average, not an individual budget. It does not open the specific wallet of every state, city, or income group. It does not measure things a household doesn’t buy routinely — such as buying property (real estate prices are a separate story) — or items absent from the survey basket. It cannot always explicitly capture subtle declines in quality (shrinkflation). It tracks sample rent across areas rather than rent in your specific neighborhood. Thus, CPI is not inaccurate; it simply answers a specific question: how much the average consumer basket’s price changed.
FACT BOX — What CPI Can and Cannot Tell You (MoSPI Framework)
CPI can show: the average price level of a fixed basket (index) and its percentage change over time (inflation rate); rural, urban, and combined trends; and broad movements down to division and item levels. Weights reflect HCES spending shares, and prices come from designated market samples.
CPI cannot show: your personal household inflation rate; exact rent in every neighborhood; your specific school or college fees; your personal hospital bill; unannounced reductions in package volume if untracked by item specifications; the monetary “value” of free government supplies; or a guarantee that groceries will instantly get cheaper when the rate drops. MoSPI measures national averages, not your personal monthly account.
The Math of Baskets, Weights, and Averages — Why Households Feel Disconnected
The official basket is a container holding everything from rice and lentils to rent, electricity, bus fares, fuel, medicines, tuition, clothing, mobile recharges, and services. Each item’s weight corresponds to its share in average spending. If food prices rise and food carries a heavy weight, headline figures spike. If rent rises slowly while food prices cool, headline inflation may appear calm, even as a renting household remains under financial pressure.
Averages cause disconnects in two main ways. First: rural and urban baskets differ. Rural households often spend a larger share on food, while urban households face higher housing and transport costs. Combined figures merge these using population weights. Second: two households in the same city experience different realities. One rents, while the other owns a home. One uses public schools, while the other pays private tuition. One buys vegetables daily from local markets, while another buys wholesale twice a month. Official weights compress these variances into a single figure.
Exclusions also create gaps. Free food grains or public subsidies offer relief to household budgets, but CPI does not count this relief as a “price drop,” because zero-cost items stay outside the pricing basket. Employer-provided quarters do not move like market rent, so they are handled separately. These methodology choices keep official data clean, not to reflect your personal lived experience perfectly.
This is why “national inflation” and “my inflation” are not twins. The national figure is necessary for policy and economic comparison. Household perception is built on personal budget shares, purchase frequency, location, and income. There is no need to dismiss either; both serve entirely different functions.
Why Groceries and Vegetables Stay Top of Mind
The human brain places greater weight on frequently seen prices. Tomatoes, onions, potatoes, milk, cooking oil, and eggs generate weekly receipts. When prices rise, it makes an impression; when they fall, it is quickly forgotten. Grains and packaged goods move more slowly, while fresh vegetables fluctuate with season and supply. Consequently, food inflation sways both news headlines and dinner table conversations.
However, while food forms a major portion of the official basket, it is not the entire budget. When vegetable prices soften while housing and services remain firm, headline inflation appears quiet, even if the grocery store experience feels different. Reverse months also occur: vegetable prices surge while other items stay stable — then headlines and household kitchens speak in unison. The rule is not that food always rises; the rule is that food is more visible, causing its psychological weight to feel larger than its official weight.
Grocery stores have their own dynamics: smaller package sizes, local retail margins, quality variations, or the same brand offered with slightly reduced weight. These show up on your receipt, but may not always be immediately visible in macro index tracking. MoSPI records prices based on fixed items and specifications. What a household picks up off the shelf may be a discounted pack, a lighter pack, or an alternate brand. Both perspectives reflect real experiences, just from different angles.
For lower-income households, this effect is even sharper. When food makes up a dominant share of the budget, a ten-rupee increase in vegetable prices hurts more than it does in a higher-income home. The official weight reflects a national average. Lower-income spending patterns differ, making food price spikes feel far more acute there — even if published headlines sound mild.
Fuel, Rent, Fees, Healthcare — Expenses That Strike Periodically
Petrol, diesel, auto fares, bus tickets, and LPG refills repeatedly hit the wallet. Regulated prices change abruptly and then remain static for months. CPI includes these in the basket, but your daily commute may not match the average consumer’s journey. A car-owning household weighs fuel heavily; someone walking or taking the metro weighs it far less.
Rent behaves differently. In many cities, rent agreements renew annually. The index may show minimal movement for months, only for a household to experience a sharp adjustment during renewal month. Modern CPI methodology incorporates rural housing and seeks to track market rent better, but your landlord is not an average sample. Rent might rise 10% in one housing society while remaining flat on the next street. Headline figures reflect the combined average of both.
School fees, textbooks, transport, and coaching follow annual academic cycles. Healthcare costs — consultations, diagnostic tests, and medicines — move at varying speeds, while insurance premiums recur annually. These items fall under services inflation. When food prices cool while services rise, the average inflation rate may appear low despite higher annual outlay. The point is not that rent and fees constantly surge, but that their cadence differs from grocery shopping, and memory links annual shocks to everyday bills.
This is why statements about “falling inflation” sound incomplete. A falling rate often stems from softening food prices. Rent, school fees, and medical expenses do not decline in tandem that same month. Households feel nothing has gotten cheaper, while data shows the average basket’s growth speed has slowed. Both statements are accurate within their respective frameworks.
Shrinkflation, Services, and Costs Unwritten on the Box
Sometimes packaging remains identical while net weight decreases. Sometimes service pricing stays constant while fine print changes — less data allowance, shorter warranties, or reduced room cleaning. This is known as shrinkflation or quality drift. Official indices compare prices based on standardized item specifications and quantities, whereas retail brands alter pack sizes dynamically. Households view a reduced pack as an effective price increase. Differences in perception can exist without implying every package shrinks every month.
Service prices operate differently from physical goods. Barbers, plumbers, tutors, delivery fees, and app charges depend on wages, local demand, and urban economics. Goods prices, by contrast, fluctuate with global supply chains. Thus, a year where food prices remain calm while service costs climb is a common economic pattern. CPI includes services in its basket, but households feel their impact primarily when bills arrive.
Online pricing has been incorporated into updated frameworks across select major cities. Yet a local neighborhood grocery store and an e-commerce app might display different prices for the same product on any given day. Averages attempt to merge both worlds, whereas an individual consumer typically shops through one channel. Discrepancies between app deals and local store rates reflect coverage boundaries rather than flawed data.
Disinflation Is Not Deflation — A Hypothetical Illustration
Disinflation means a slowdown in the rate at which prices rise, not a drop in price levels. An inflation rate dropping from 5% to 3% does not return prices to where they were three years ago. The index remains elevated; only its upward slope moderates. Actual cheapening occurs during deflation, when the index itself declines — meaning the average basket’s price drops. Equating disinflation with lower prices is one of the most common everyday misunderstandings.
Hypothetical Example (Not official data; for illustrative purposes only)
Suppose a simplified basket contains just three items: groceries, rent, and school fees. Last year, the total basket cost was 100. This year, groceries cost 102, rent 106, and school fees 108 — making the combined basket cost 104. The inflation rate is roughly 4%. Next year, groceries rise to 101, rent to 108, and school fees to 110 — bringing the combined basket to 105. The inflation rate now drops to around 1%. Newspapers headline that inflation has fallen. What does the household see? Groceries are slightly cooler, but rent and fees are higher than last year, leaving the total bill heavy. The rate dropped, but the price level did not, and individual spending mixes vary. These numbers are purely illustrative to demonstrate that speed and level are distinct questions.
This logic can also work in reverse. If the headline rate is high but your specific basket cools that month, your household feels relief even as headlines warn of rising costs. Rather than judging expenses solely by news headlines, look directly at your basket composition.
A Hypothetical Household Budget — How Changing Weights Shift Perception
Below is an illustrative (non-official) breakdown of a typical household budget. Amounts are hypothetical to illustrate proportional shares.
| Category | Monthly Share (Example) | How It Is Felt at Home |
|---|---|---|
| Food, Groceries, Vegetables | 35–45% (Often higher in lower-income homes) | Weekly receipts; high recall memory |
| Rent / Housing Costs | 15–30% (Higher in rented urban setups) | One or two shocks per year |
| Fuel & Local Travel | 8–15% | Frequent charges at fuel pumps and auto fares |
| Schooling & Coaching | 8–20% | At the start of the academic session |
| Healthcare & Medicines | 5–12% | Heavy in months with illness |
| Other Services, Clothing, Recharges | Remaining Share | Scattered, less dramatic |
If food accounts for 45% of a household’s spending and vegetable prices rise, felt inflation will outpace the official national average. If rent accounts for 30% and comes up for renewal, the month feels heavy even if headline food inflation softens. Lower-income households typically allocate a larger share to food, making food price fluctuations feel more severe. Higher-income households allocate larger shares to services, education, and healthcare; even when headlines indicate calm food prices, their annual expenses may rise. Personal budget allocation is the true multiplier of household inflation.
This table is an analytical mirror, not policy advice. Mapping your spending shares on paper clarifies which household reality news headlines reflect and which they do not.
Practical Perspective
Avoid treating news headlines as absolute indicators. MoSPI’s CPI is an analytical tool tracking price movements in a national average basket. It is not designed to mirror your personal salary slip or monthly budget. Divide monthly expenses into four key buckets: daily groceries, fuel and travel, periodic expenses like rent/fees/premiums, and irregular costs like healthcare. Each bucket moves at its own pace. When inflation rates drop, evaluate which bucket softened and which stayed unchanged.
Evaluate grocery bills in the context of your annual budget rather than judging solely by this week’s tomato prices. One expensive week does not define an entire year, nor does one cheap week offset annual rent increases. Track both pack volume and unit price to differentiate true price shifts from subtle volume reductions. Moving cities, renting a house, or choosing private schooling shifts your personal basket away from official averages — this is simple arithmetic, not a contradiction.
For lower-income households, tracking food spending accurately provides clarity. Key financial stability comes from steady food and local fuel prices rather than average headline rates. For rented accommodation, account for renewal months separately to avoid distorting annual averages. These observations serve as analytical context rather than financial or investment advice. Simply assess official statistics against their intended scope, and manage household budgets according to personal spending patterns.
💡 Callout: A falling inflation rate is like pressing the brakes, not putting the car in reverse. The speed decreases, but a car parked on an incline remains at a high altitude.
A simple one-page monthly budget log covering key spending categories provides clearer insights than headlines alone. When national data and personal budgets align, confidence grows; when they diverge, understanding spending shares helps explain why.
Conclusion
Media reports on “falling inflation” typically refer to the inflation rate. The overall price level, represented by the CPI index, can remain elevated. Lived household perception moves on a distinct track driven by frequent grocery bills, annual rent or fee renewals, fuel, healthcare, services, and the food share in the budget. MoSPI’s framework relies on an average basket, survey weights, national market samples, and defined exclusions. It provides a structured measure of average trends rather than a complete mirror of an individual neighborhood.
Disinflation is not a certificate of falling prices. Personal spending patterns often diverge from official baskets, particularly for lower-income or tenant households. Recognizing this difference helps clarify personal finances. Official statistics serve macro analysis, while personal budgets track actual expenses — understanding both requires asking the right questions of each.
FAQ
1. Does a falling inflation rate mean prices have dropped?
No. A falling rate usually indicates disinflation — a slowdown in the pace of price increases. For prices to actually decline, the CPI index (price level) itself must fall. The two concepts are distinct.
2. Why doesn’t my grocery receipt match official inflation numbers?
Because CPI tracks an average national basket with average spending weights. Your location, rent, schooling costs, food budget share, and purchasing habits differ from national averages. Frequently purchased items also leave a stronger psychological impression.
3. How are rent and school fees tracked in MoSPI’s CPI?
Housing and education form dedicated divisions within the basket, weighted according to expenditure survey data. Individual landlords or private schools may not align with national sample averages, leading to adjustments occurring at different times.
4. Why is shrinkflation less obvious in official figures?
The index compares prices based on defined item specifications and standardized unit quantities. In retail markets, package sizes and product formulations change dynamically. Consumers perceive reduced quantities as higher costs, whereas standardized metric tracking may record these shifts differently depending on specifications.
5. Is inflation always higher for lower-income households?
Not always, but it often differs. When food and fuel constitute a larger share of a household’s total spend, fluctuations in those categories have a disproportionate impact. The distinction lies in spending composition rather than an inherently higher rate every month.
*Disclaimer: This article is for informational purposes and does not constitute investment or tax advice. For official methodologies and basket details, refer to MoSPI CPI publications. Hypothetical examples and budget tables are illustrative, not government data.*
Disclaimer: Verify official CPI data with MoSPI. This is an educational analysis, not personalized budgeting advice.