Curve का मतलब पहले समझें
Bell curve किसी distribution का model है, यह नियम नहीं कि हर marks list इसी shape में होनी चाहिए। Tool mean और standard deviation से normal curve बनाता है और target score को उस model पर रखता है। Z-score, target से नीचे अनुमानित area और ऊपर का complementary area मिलता है। Known parameters भर सकते हैं या numeric list से estimate निकाल सकते हैं। List देने पर actual-list percentages अलग दिखते हैं, ताकि तुलना हो सके। Tool grades assign नहीं करता, class को fixed categories में नहीं बाँटता और observed scores की normality test नहीं करता। Result को model के रूप में पढ़ें।
Known mean और SD भरें
पहले से सही values हों तो Known mean और SD mode चुनें। Mean, positive standard deviation और target score भरें। Mean 70, SD 10 तथा score 80 होने पर target mean से एक SD ऊपर है। बनाएँ दबाने पर z = 1 और normal-model percentile लगभग 84.13% मिलेगा। यह चुने हुए normal model का percentage है, जरूरी नहीं कि वास्तविक classmates में इतने लोग नीचे हों। तीनों values एक ही unit और scoring scale की रखें। Negative measurements भी स्वीकार हैं, क्योंकि normal model केवल परीक्षा के marks नहीं बल्कि दूसरे numeric measurements पर भी लगाया जा सकता है।
Score list से parameters निकालें
Score list mode में numbers commas, spaces, semicolons या नई lines से अलग करके डालें। कम से कम दो और अधिकतम पाँच हजार values रखें। Tool mean निकालता है और sample या population standard deviation चुनने देता है। Sample SD में squared deviations का sum n minus one से divide होता है; population SD में n से। Data किस चीज को represent करता है, उसके अनुसार convention चुनें। पसंद का result पाने के लिए convention बदलना सही तरीका नहीं। Input में केवल numbers रखें, student names और column headers नहीं। Identical scores की SD zero होगी, इसलिए उस list का normal-model percentile नहीं निकलेगा।
Model और actual list अलग देखें
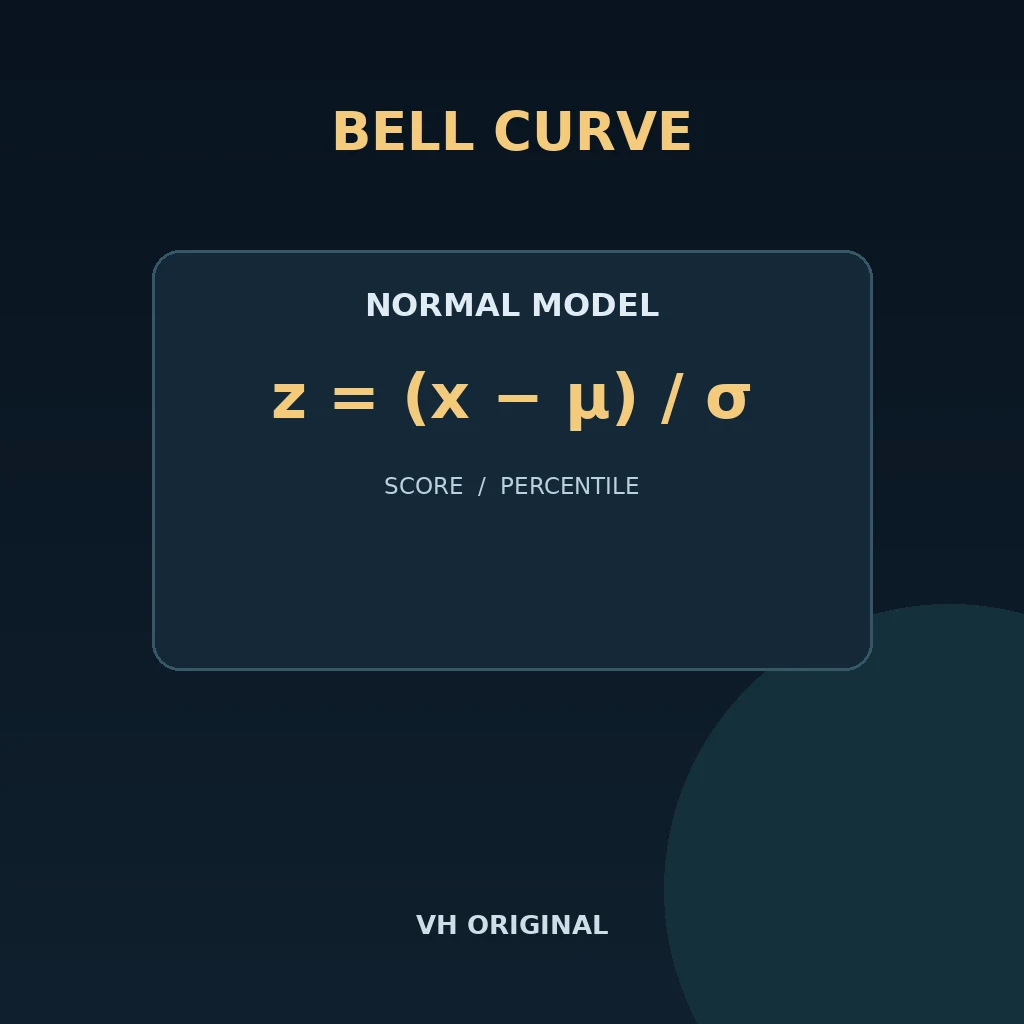
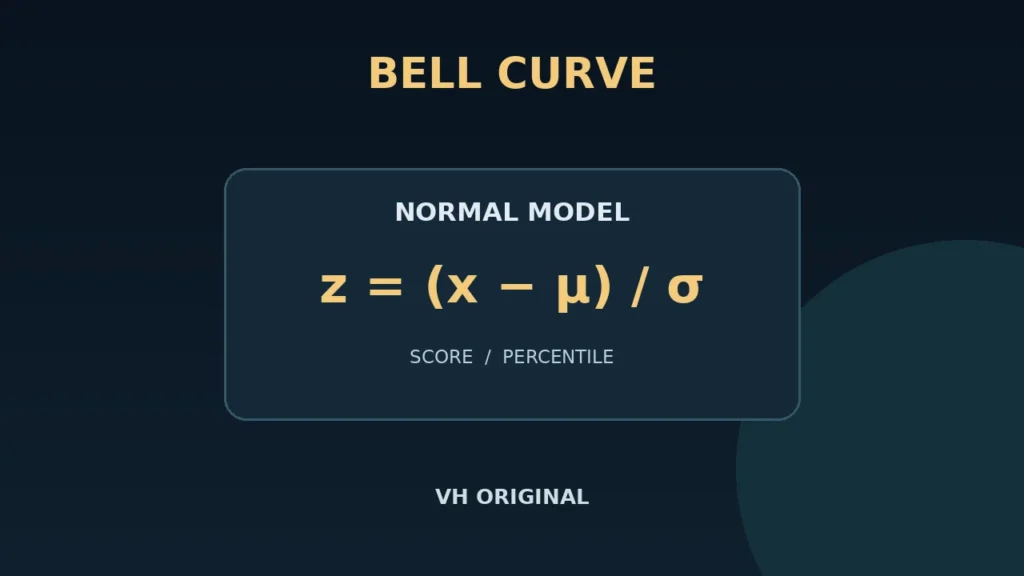
Normal percentile निकालने के लिए target को standardise किया जाता है: z = (score − mean) / SD। फिर cumulative normal model लगाया जाता है। Actual-list percentages सीधे counts से निकलते हैं; उनमें normality की assumption नहीं। Report target से नीचे या बराबर values का proportion देती है। Midrank percentage में ties का आधा हिस्सा नीचे माना जाता है। छोटी class या बहुत ties होने पर दोनों conventions अलग दिख सकते हैं। इनमें से कोई अकेला certified class rank नहीं है। उदाहरण list 50, 60, 70, 80, 90 में target 70 का below-or-equal 60% और midrank 50% है।
Chart और SD bands पढ़ें
Chart की horizontal scale minus four से plus four standard deviations तक है। Shaded region target से नीचे model area बताती है और vertical marker target की position दिखाता है। Target displayed range से बाहर हो तो marker edge पर रहता है, लेकिन numeric percentile actual z-score से निकलता है। Report mean plus या minus एक, दो और तीन SD के intervals तथा approximate normal-model coverage दिखाती है। ये bands observed minimum और maximum नहीं हैं। Normal model की tails finite interval से आगे जाती हैं, इसलिए bounded exam scale से बाहर भी curve दिखाई दे सकती है। इसे literal student counts के बजाय visual model मानें।
Result से जबरन grades न तय करें
Skewed, multimodal, bounded या बहुत tied scores normal curve से काफी अलग हो सकते हैं। Calculator इन patterns का diagnosis नहीं करता, cheating detect नहीं करता और acceptable grade distribution निर्धारित नहीं करता। Plot को normal बनाने के लिए student outcomes बदलना ठीक नहीं। Original data बचाएँ तथा discussion में SD convention, model assumptions और tie convention बताएँ। Numeric report के लिए JSON और vector chart के लिए SVG डाउनलोड करें। Inputs browser में process होते हैं; student identities देने की जरूरत नहीं। SVG में accessible label है, लेकिन दूसरे document में result share करते समय एक साफ written explanation भी उपयोगी रहती है।
FAQ
क्या normal percentile class rank है?
नहीं। यह normal model का estimate है। Actual rank observed scores और chosen tie rule पर निर्भर है।
Sample और population SD अलग क्यों हैं?
Variance denominator अलग है: n minus one और n। Data क्या represent करता है, उसके अनुसार चुनें।
सभी scores बराबर हों तो क्या होगा?
SD zero होने पर meaningful z-score नहीं मिलता। Tool गलत percentile देने के बजाय error देता है।
क्या data normal है यह जाँचेगा?
नहीं। Specified normal model और list descriptive information दिखती है। यह normality test नहीं है।
Curve exam scale से बाहर क्यों जा सकती है?
Normal distribution unbounded है। इसलिए model खास examination के possible marks से बाहर भी जा सकता है।
क्या chart डाउनलोड होगी?
हाँ। SVG में scalable vector chart मिलेगी। JSON report numeric results और conventions अलग रखती है।
Advice
पहले sample check करें, फिर अपना input इस्तेमाल करें। Original source बचाएँ और result जमा या share करने से पहले assumptions review करें। Generated files तैयारी में मदद करती हैं; final academic या study decision के लिए सही source, course instructions और human review जरूरी है।
संबंधित टूल
Educational helper है। Output इस्तेमाल करने से पहले लागू rules, import settings और model assumptions जाँचें।