Understand what the curve represents
A bell curve is a model of a distribution, not a rule that every set of marks must follow. This tool draws a normal curve from a mean and standard deviation, then places a target score on that model. It reports a z-score, the estimated area below the target and the complementary area above it. You can enter known parameters or estimate them from a numeric list. When a list is supplied, the report also shows actual list percentages for comparison. It does not assign grades, force a class into fixed categories or test whether the observed scores are normally distributed.
Enter known mean and standard deviation
Choose Known mean and standard deviation when you already have appropriate values. Enter the mean, a positive standard deviation and the target score. For mean 70, SD 10 and score 80, the target is one standard deviation above the mean. Generate reports z = 1 and a normal-model percentile of approximately 84.13%. That percentage describes the chosen normal model, not necessarily the share of real classmates who scored less. Check that all three values use the same unit and scoring scale. Negative measurements are allowed because a normal model can describe quantities beyond examination marks.
Estimate parameters from a score list
Choose Calculate from a score list and paste numbers separated by commas, spaces, semicolons or new lines. The tool accepts between two and five thousand values. It calculates the mean and lets you choose sample or population standard deviation. Sample SD divides the sum of squared deviations by n minus one; population SD divides by n. Use the convention appropriate to the data rather than switching until you like the result. The input must contain only numbers, with no student names or column headers. Identical scores have zero standard deviation, so a normal-model percentile cannot be calculated for that list.
Compare model percentile with actual list percentages
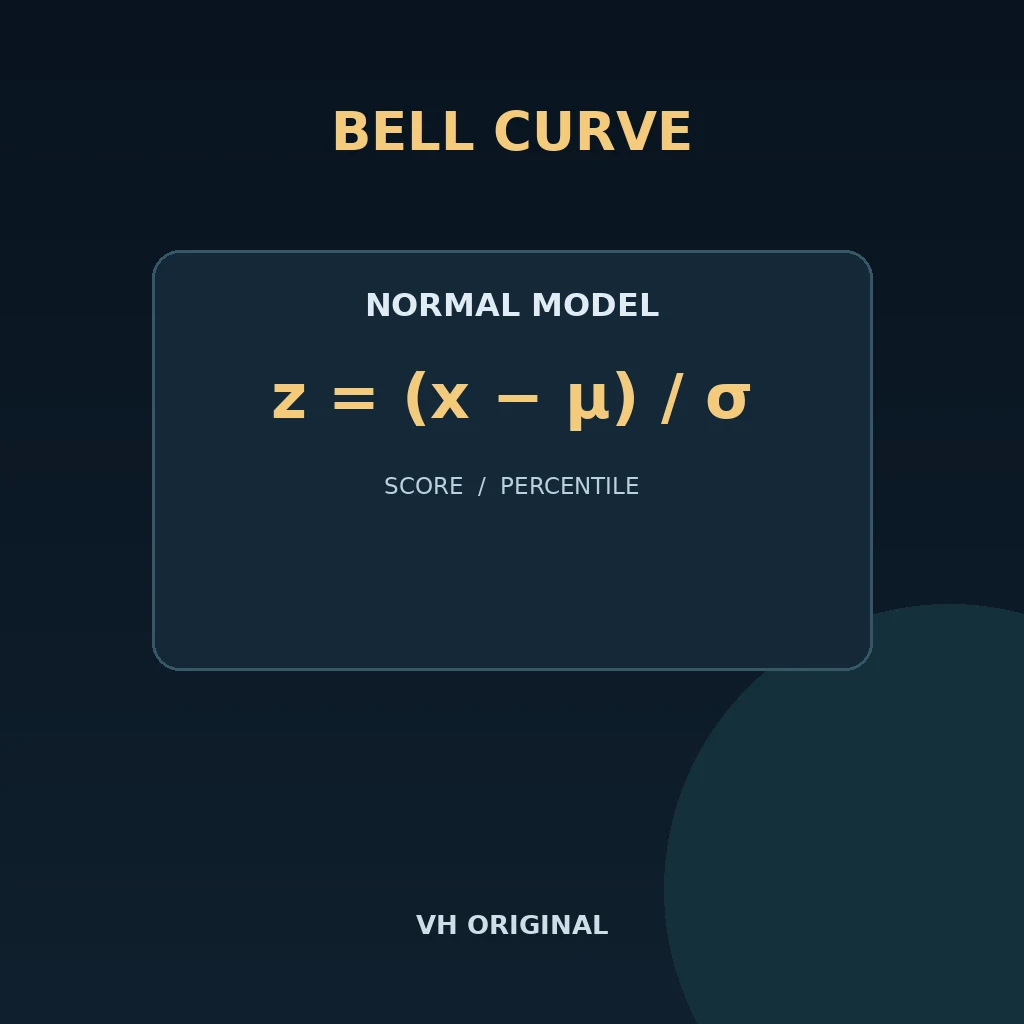
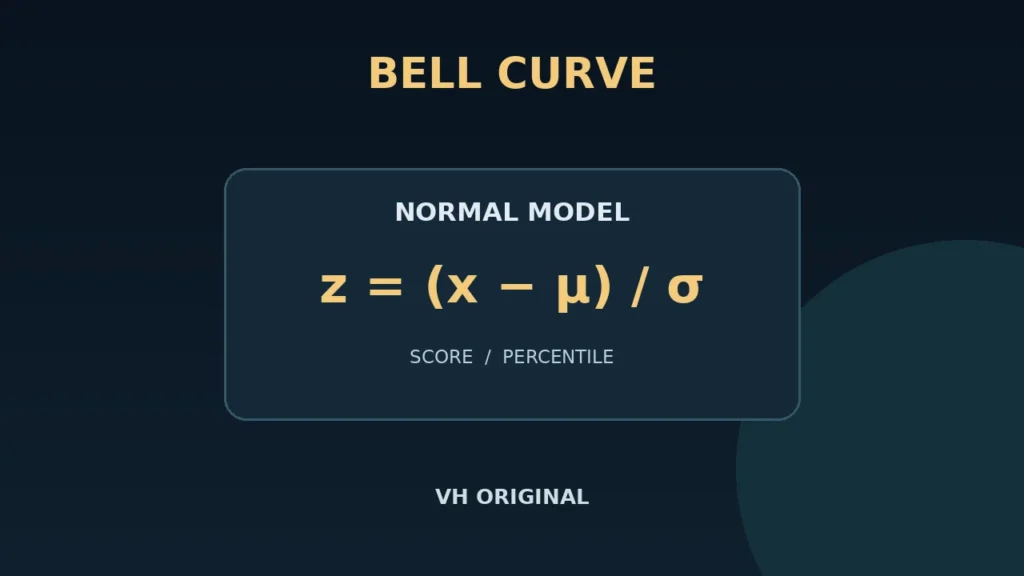
Normal percentile comes from the cumulative normal model after standardising the target: z = (score − mean) / SD. Actual-list percentages are counted directly and do not assume normality. The report gives the proportion below or equal to the target and a midrank percentage that allocates half of ties below the target. These conventions can differ noticeably for a small class or many tied marks. Neither figure by itself is a certified class rank. State the method whenever you share a percentile. For the list 50, 60, 70, 80, 90 and target 70, below-or-equal is 60% and midrank is 50%.
Read the chart and standard-deviation bands
The curve chart uses a horizontal scale from minus four to plus four standard deviations. The shaded region illustrates model area below the target, and the vertical marker shows its position. A target outside the displayed range is placed at the chart edge; the numeric percentile still uses its actual z-score. The report lists mean plus or minus one, two and three SD, with approximate normal-model coverage. These bands are not observed minimum and maximum scores. A normal model has tails beyond any finite interval, so it can extend outside a bounded exam scale. Treat the chart as a visual model rather than literal student counts.
Use the result without forcing a grading decision
Skewed, multimodal, bounded or heavily tied scores can differ substantially from a normal curve. The calculator does not diagnose those patterns, detect cheating or prescribe an acceptable grade distribution. Do not change student outcomes merely to make a plot look normal. Keep the original data and explain the SD convention, model assumptions and tie convention in any discussion. Download JSON for the numeric report or SVG for the vector chart. Inputs are processed locally and do not require student identities. The SVG includes an accessible chart label, but a written explanation remains useful when sharing the result in another document.
FAQ
Is normal percentile the same as class rank?
No. It is an estimate under a normal model. Actual rank depends on the observed scores and the chosen tie rule.
Why do sample and population SD differ?
They use different variance denominators, n minus one and n. Choose based on what the supplied data represent.
What if every score is identical?
SD is zero, so dividing by it cannot give a meaningful z-score. The tool reports an error rather than a percentile.
Does it check whether data are normal?
No. It draws the specified normal model and reports descriptive list information. It is not a normality test.
Can the chart extend beyond possible exam marks?
Yes. A normal distribution is unbounded, so a model may extend beyond a particular examination scale.
Can I download the chart?
Yes. The SVG download preserves a scalable vector chart. The JSON report separately records the numeric results and conventions.
Advice
Check the sample first, then use your own inputs. Keep the original source and review every assumption before submitting or sharing a result. Generated files help with preparation; the final academic or study decision still needs the appropriate source, course instructions and human review.
Related tools
Educational helper. Check applicable rules, import settings and model assumptions before using the output.