Choose the question before calculating
A useful sample size begins with the question you plan to answer. Estimating a survey proportion is different from comparing two group means. This calculator separates those jobs so that a margin of error is not mistaken for statistical power. Survey mode estimates completed responses for a proportion using a normal approximation. Two-means mode estimates participants per group for a two-sided comparison with equal group sizes. Both are planning aids, not a replacement for a study protocol. The tool does not choose a clinically meaningful effect or certify that a particular design is suitable.
Survey sample size: enter your assumptions
Select Survey sample size. Enter confidence between 80% and 99.9%, expected proportion and margin of error. The margin is in percentage points: 5 means plus or minus five percentage points, not five percent of your estimated proportion. If the proportion is unknown, 50% is a common conservative choice within this formula. Leave population size empty for the large-population calculation, or enter a known whole-number population of at least two. Set expected nonresponse to zero when you want only the completed-response target. Generate shows the base result, adjusted target and declared assumptions together.
How the survey calculation works
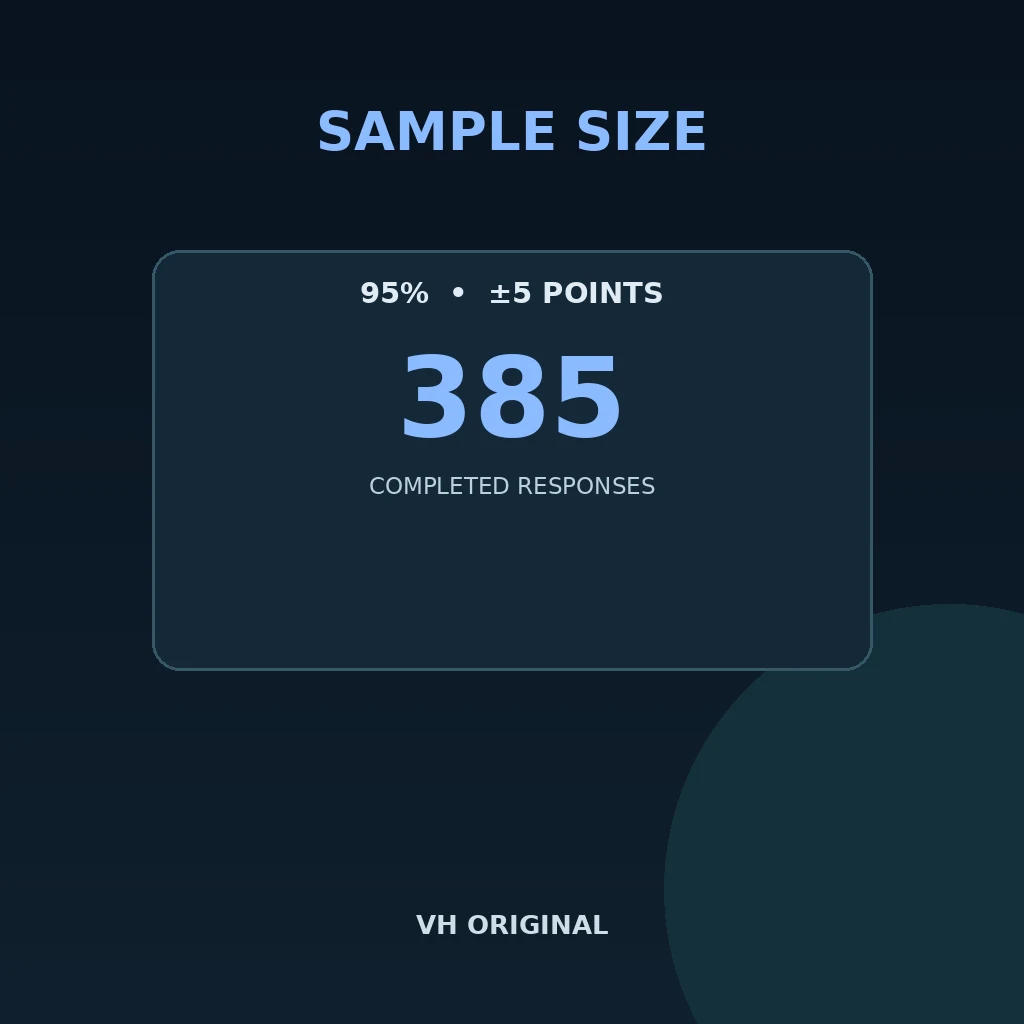
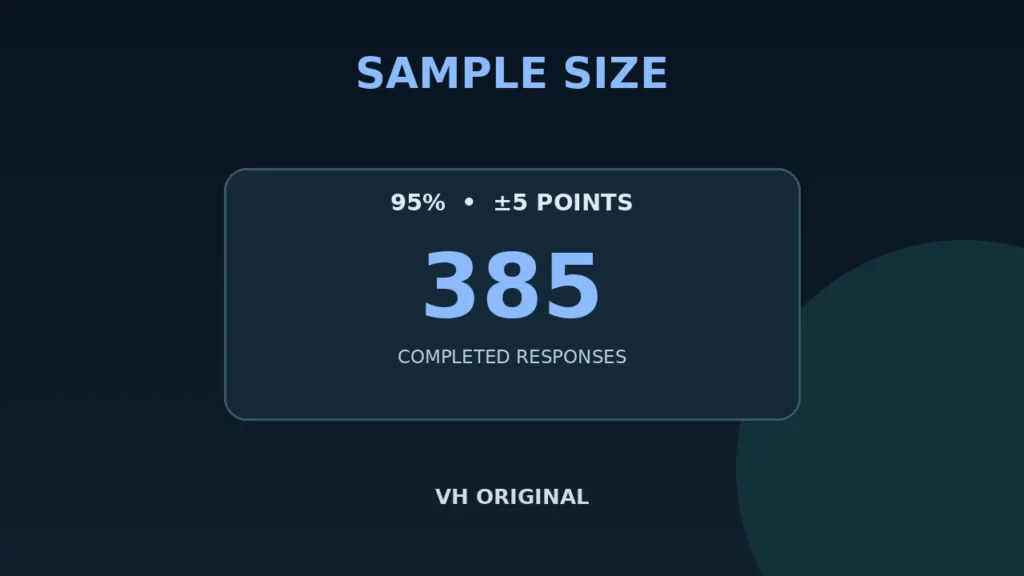
The initial formula is n0 = z² p(1 − p) / e², with p and e expressed as fractions. For a supplied population N, the finite-population adjustment is n = n0 / [1 + (n0 − 1)/N]. The completed-response target is rounded upward. At 95% confidence, 50% proportion and five percentage-point precision, the large-population result is 385. With population 1,000, the target is 278. These figures assume a simple random sample of independent responses. A convenient online poll is not made representative merely by collecting the calculated number of answers.
Two means and target power
Select the two-means mode and enter standardized effect size d. Here d describes the mean difference divided by the assumed common standard deviation. It must be positive; choose it from credible prior data or a justified study objective, rather than from the desired sample size. Enter target power between 50% and 99.9%. Confidence determines two-sided alpha: 95% corresponds to alpha 0.05. The calculation uses approximately n = 2(z1−alpha/2 + zpower)²/d² for each group. With d = 0.5, 80% power and 95% confidence, the result is 63 per group, or 126 total.
Allow for nonresponse without changing the question
Expected nonresponse or dropout inflates recruitment, not the required number of completed observations. The tool divides the completed target by one minus the nonresponse fraction and rounds upward. A 20% allowance turns 385 completed survey responses into a recruitment target of 482. In two-means mode the allowance is applied per group, then doubled for the total. If adjusted recruitment exceeds a supplied survey population, the report warns that the plan may be infeasible. Nonresponse can also introduce bias, which an inflated number alone cannot solve. Keep a realistic follow-up plan and report response patterns.
Read the limitations before using a report
The survey formula uses normal approximation and can be inadequate for extreme proportions or very small targets. Clustered designs, weights and unequal selection probabilities need additional design calculations. The two-means calculation is a z approximation, not an exact t-test power solution. It assumes independent continuous outcomes, equal variance and equal allocation. Paired studies, binary outcomes, survival outcomes, multiple comparisons and unequal groups need other methods. Results above one billion are rejected to prevent unusable output. Download the JSON report to preserve the mode and assumptions, then review your design with a qualified supervisor or statistician.
FAQ
Is 50% always the correct proportion?
It is a conservative assumption within this precision formula when you lack prior information. Reliable relevant data may justify another value.
What does five-point margin mean?
An estimate of 40% with five percentage-point precision is approximately 35% to 45%, under the declared assumptions.
Does the tool calculate achieved power?
No. Two-means mode calculates approximate sample size for your requested target power. It does not calculate achieved power from an existing sample.
Why is the total twice the group result?
The two-means mode assumes two independent groups with equal allocation. Each group needs the reported per-group target.
Can I use it for a paired or clinical study?
Not directly. Those designs may need different models, exact methods and a reviewed protocol; use a suitable design-specific calculation.
Is data uploaded?
No study dataset is needed. Numeric assumptions are processed locally and the report is downloaded from your browser.
Advice
Before submitting or sharing the result, compare it with your original input and the requirements of your project. Keep the source text or declared assumptions so another person can review the output. A generated file is useful only when its content and format match the job you need it to do.
Related tools
Educational helper. Review source accuracy, study assumptions and final output before use.
Method reference: NIST sample size planning